
Hello there reader, if you stumbled upon this post I recommend reading this first but if you’re a lazy reader, here are some market jargon that you need to know at least:
Support – A price level where people would most likely buy.
Resistance – A price level where people would most likely sell.
Before you guys read on this post, I recommend watching this first from Rayner Teo, who’s actually one of the people who influenced my trading journey (and how I actually discovered this MA on steroids as what he would call it 😂)
If you’ve finished watching these 2 videos, then great because this is what we’re going to tackle for this post.
Here’s how I actually approach the Donchian Channels indicator.
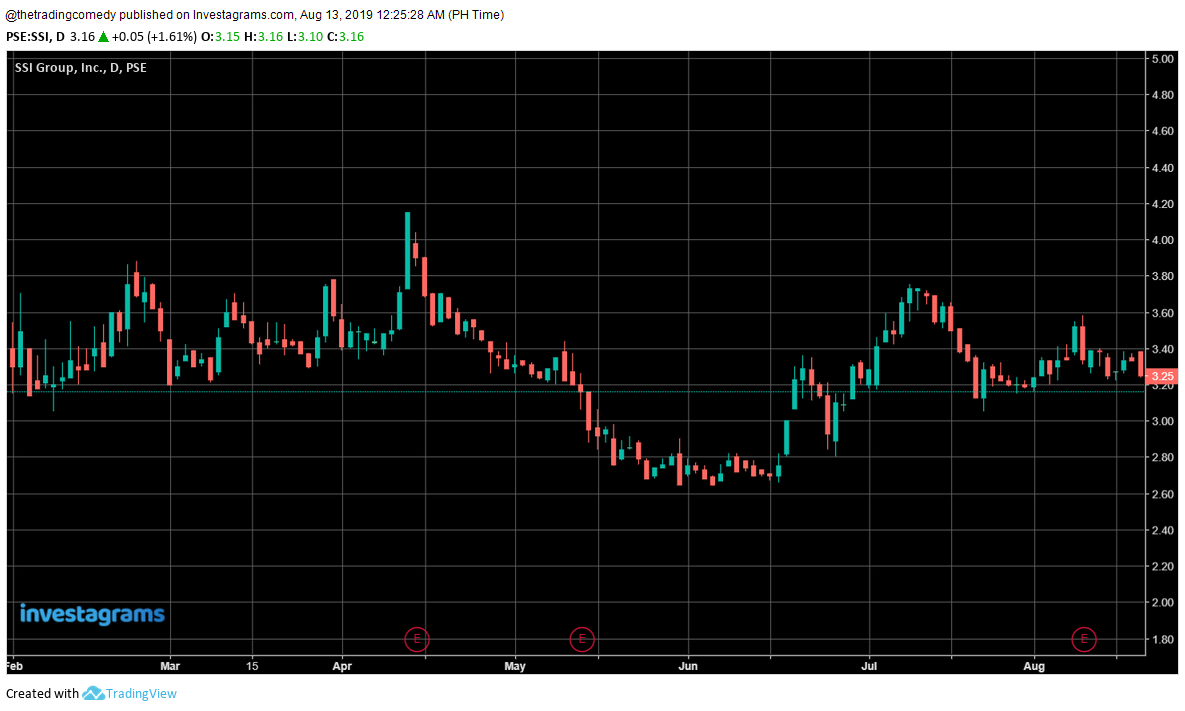
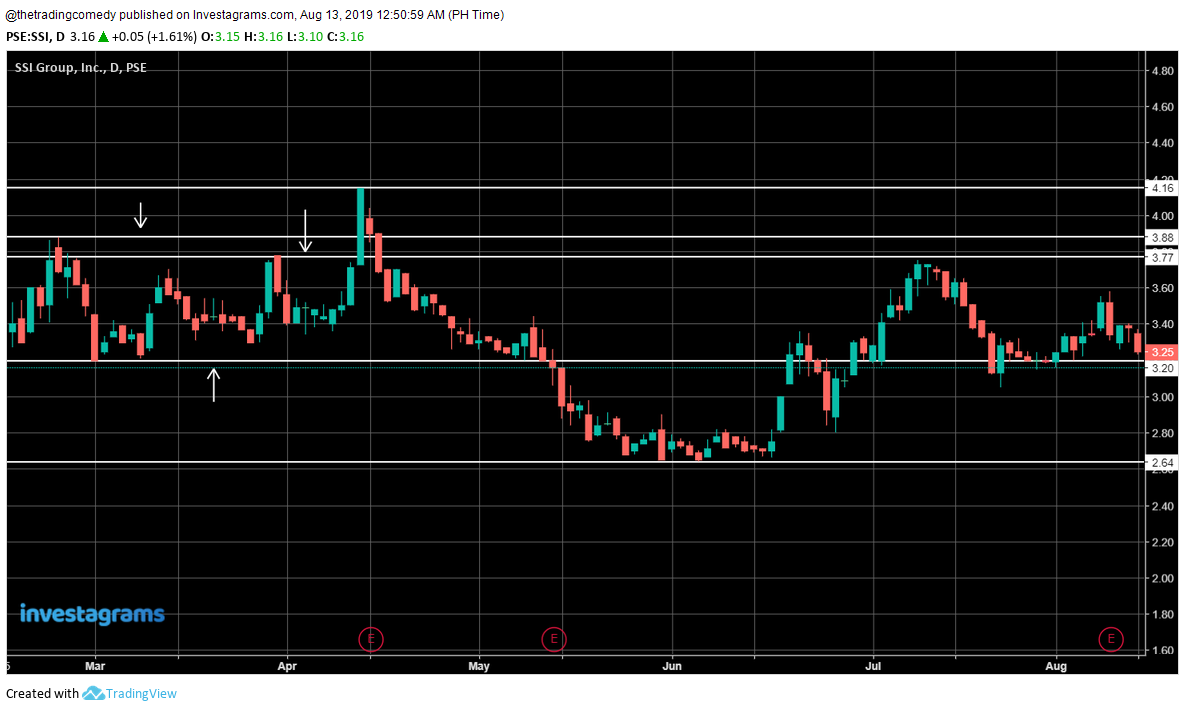
Let’s say I give you this chart right now, I would ask you, “Where is the support and resistance?”
Most of you would probably answer:
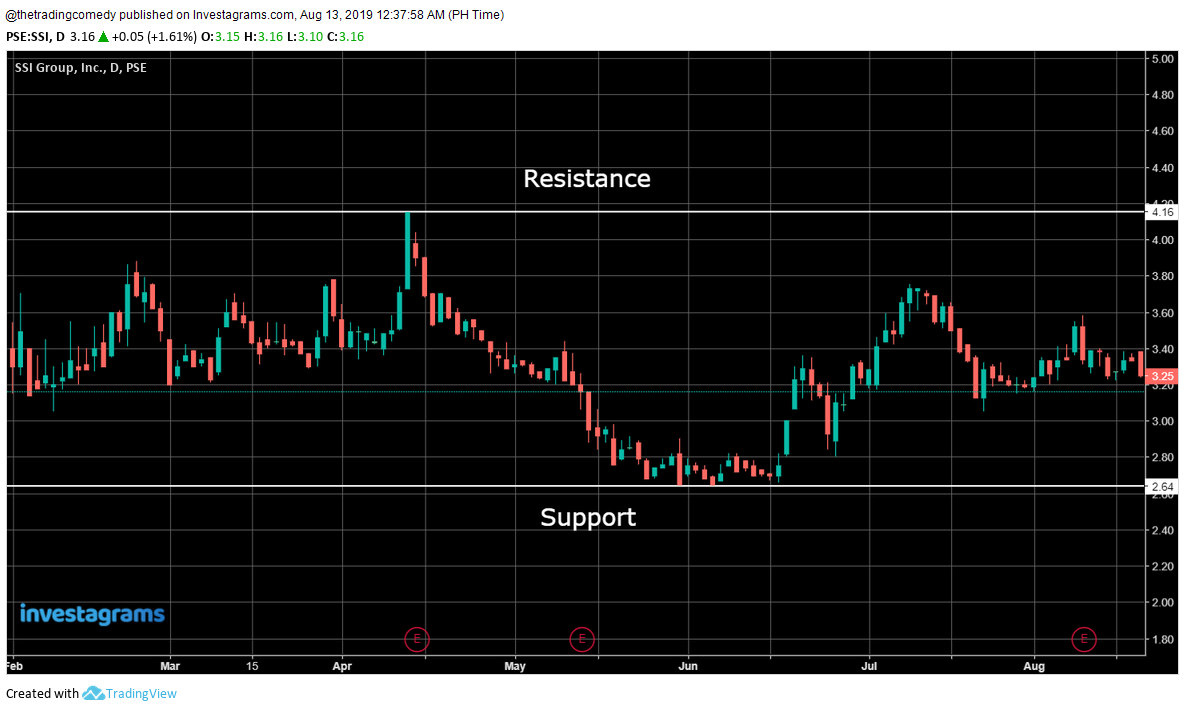
But wait, what if I told you that there’s actually more levels than those mentioned above?

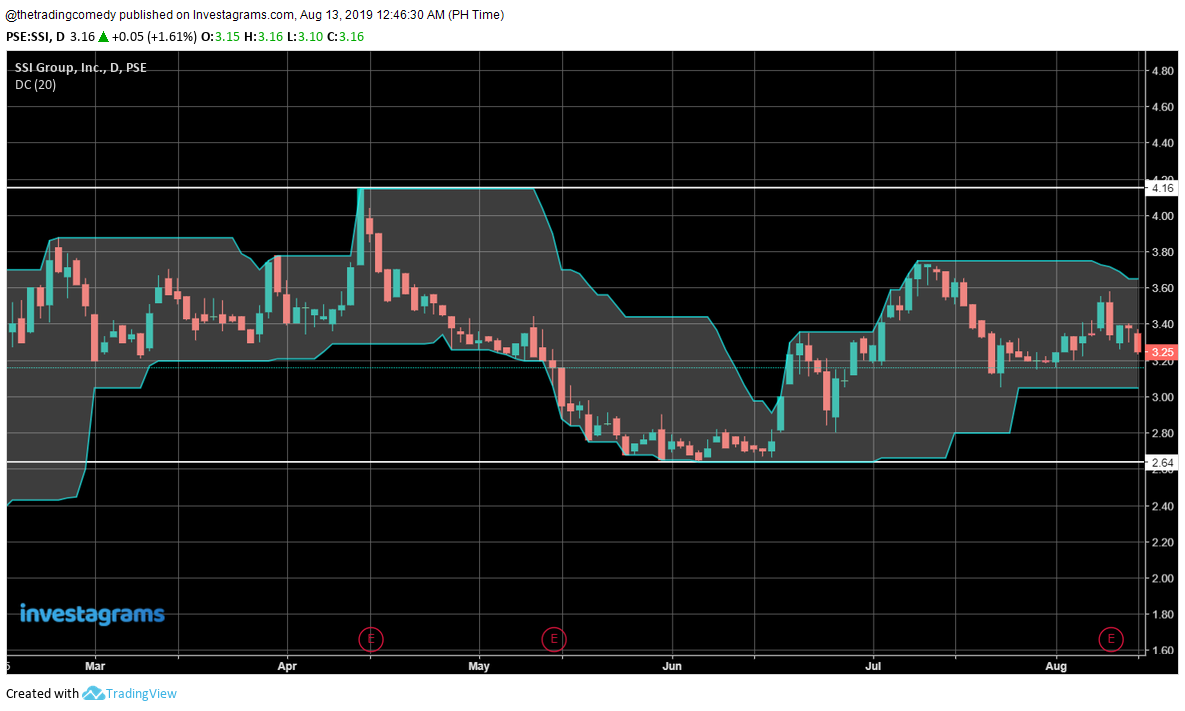
Here’s where the Donchian Channels come to the rescue!!! 😂

But wait we won’t be needing that middle band, since we are just focusing on finding other support and resistance levels so let’s clean it up a bit…
Perfect! Now let’s plot those other levels that we see (focus on the left part of the picture)
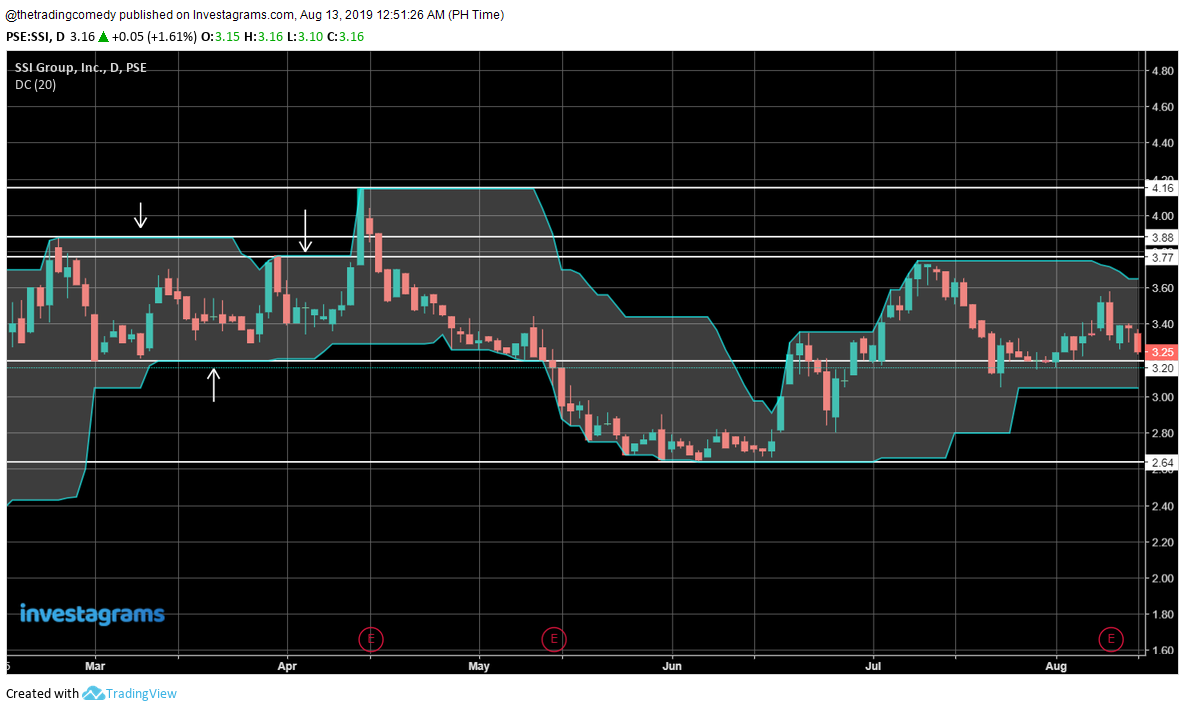
And voila! You have more supports and resistances to work with! 😂
But wait…I noticed something in the chart….
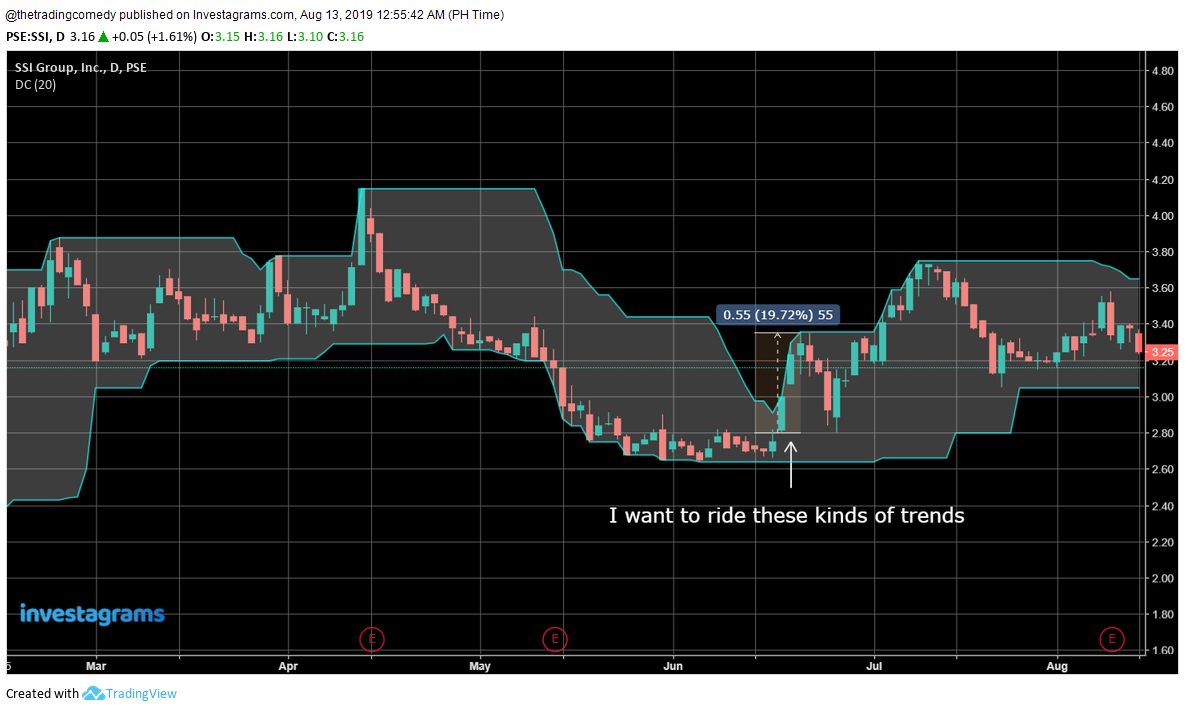
Yes, these are tricky to catch
Well I’m about to tell you right now…the default length of the Donchian Channels (20) won’t give you much entry opportunities.

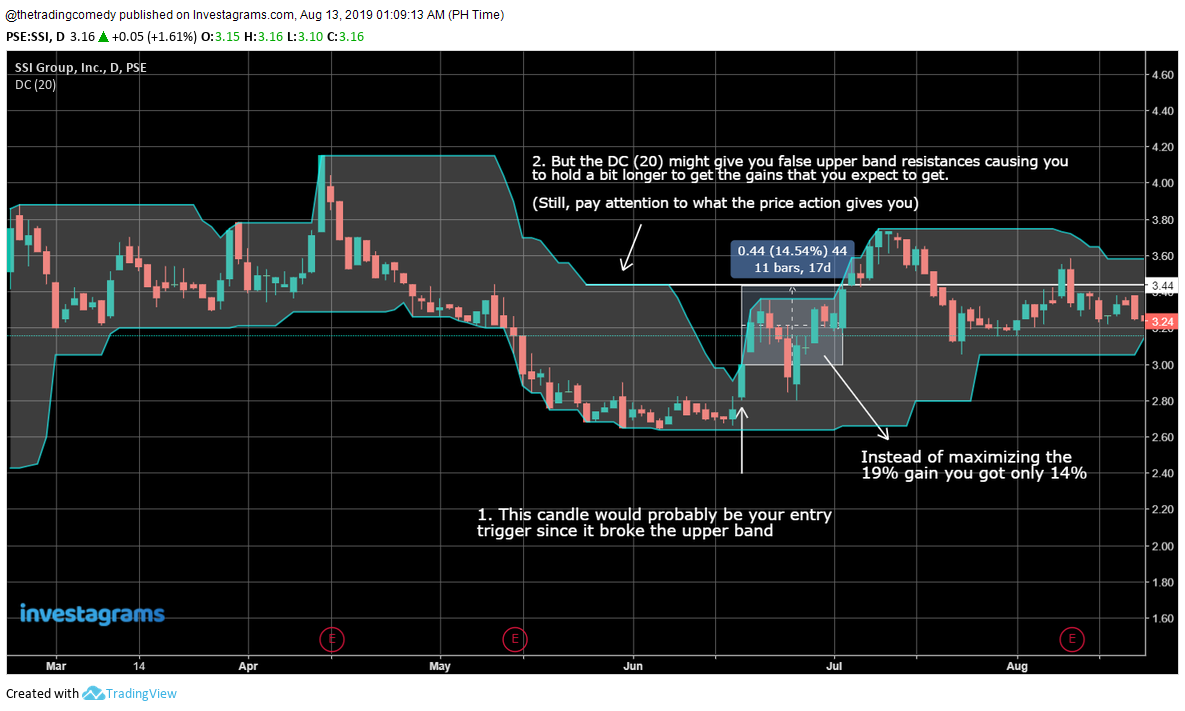
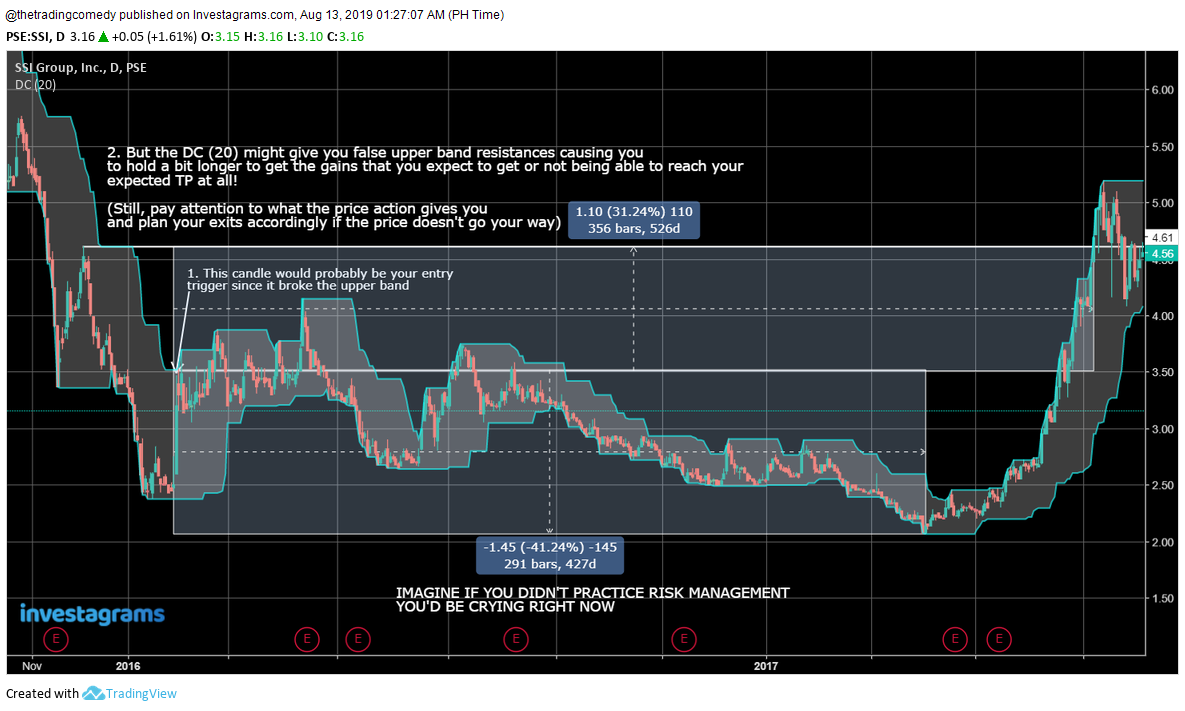
If you paid attention to the video, the usual entry triggers for the Donchian Channels are usually the break of the upper band (if you’re going long) and the break of the lower band (if you’re going short)
Assuming that we religiously follow the entry trigger rules of the Donchian Channels…
Here’s another heartbreaking backtest:
So how can we optimize this? There’s no way in hell I’m going to wait for that long especially if there are plenty of stocks in the sea…
Well here’s a trick that I learned and it’s actually simple:
Change the Donchian Channels length to 10.
Now backtest again now using these simple steps:
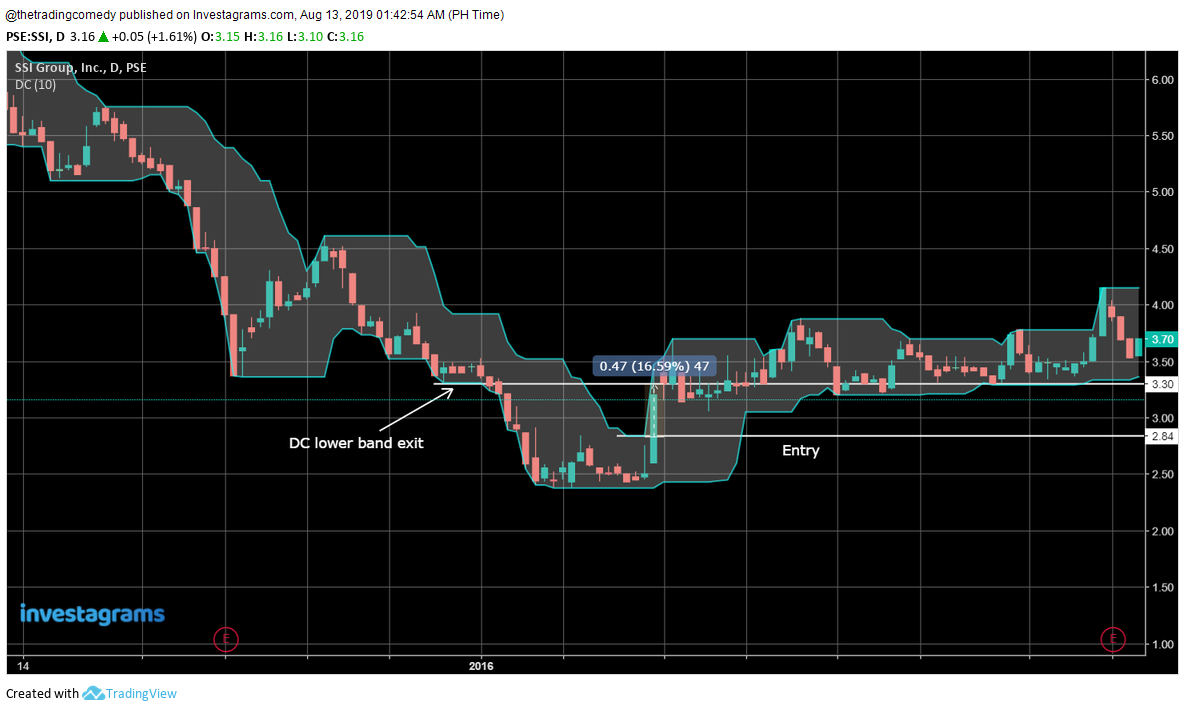
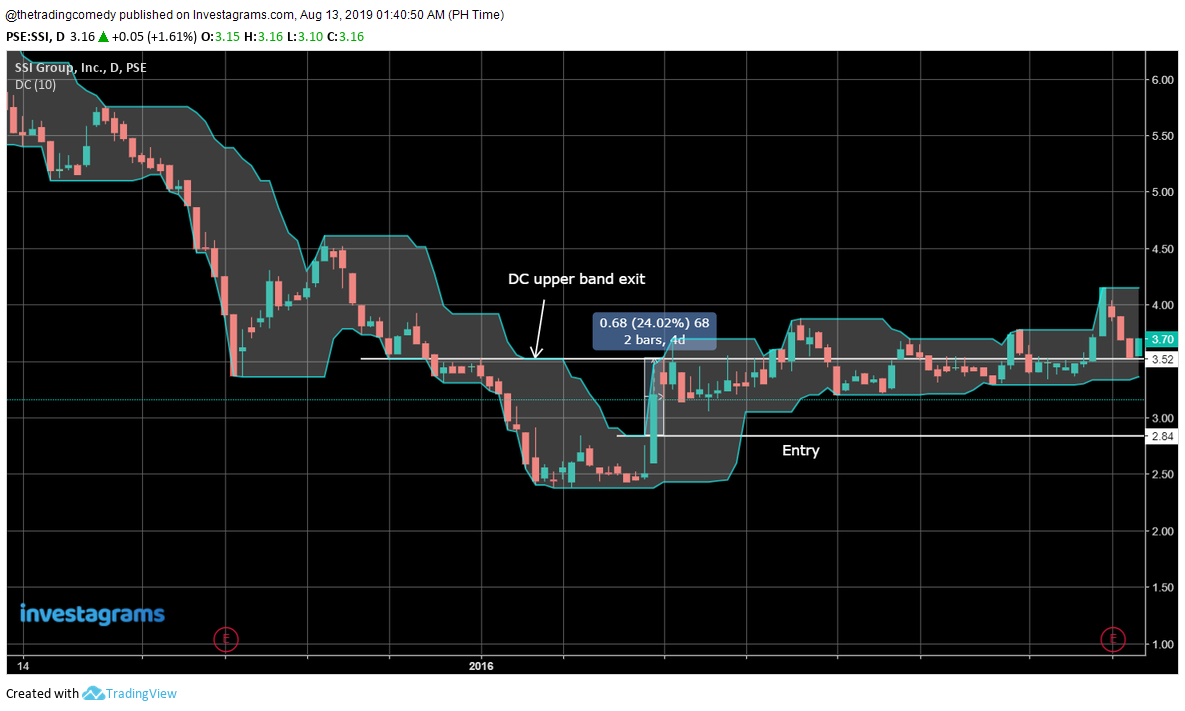
- Find an upper band (for long positions) or a lower band (for short positions) that you want to enter in.
- Scan for past lower bands or upper bands for your desired Target Prices (TP)
- Simulate the breakout of the chosen band, forward test and see if it works.
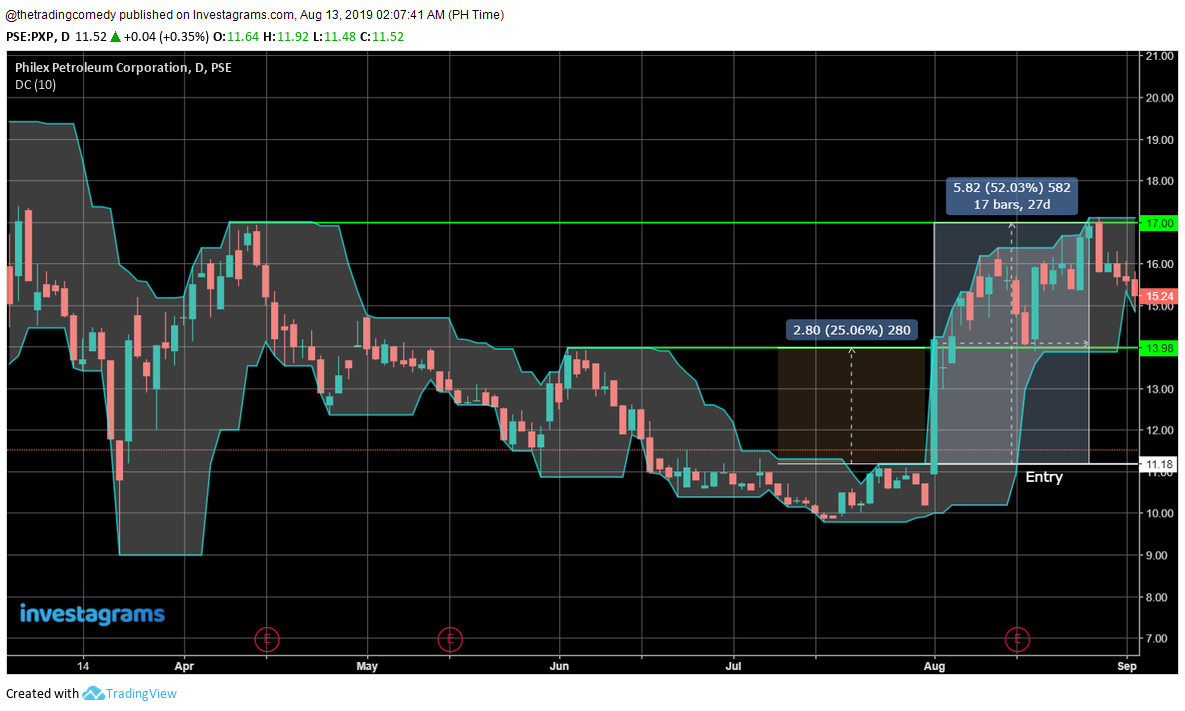
Going back to the previous chart, I’m going to use long positions as an example since the Philippine Stock Exchange doesn’t support shorting yet (yeah, it sucks I know but I hope we get there soon 😅)
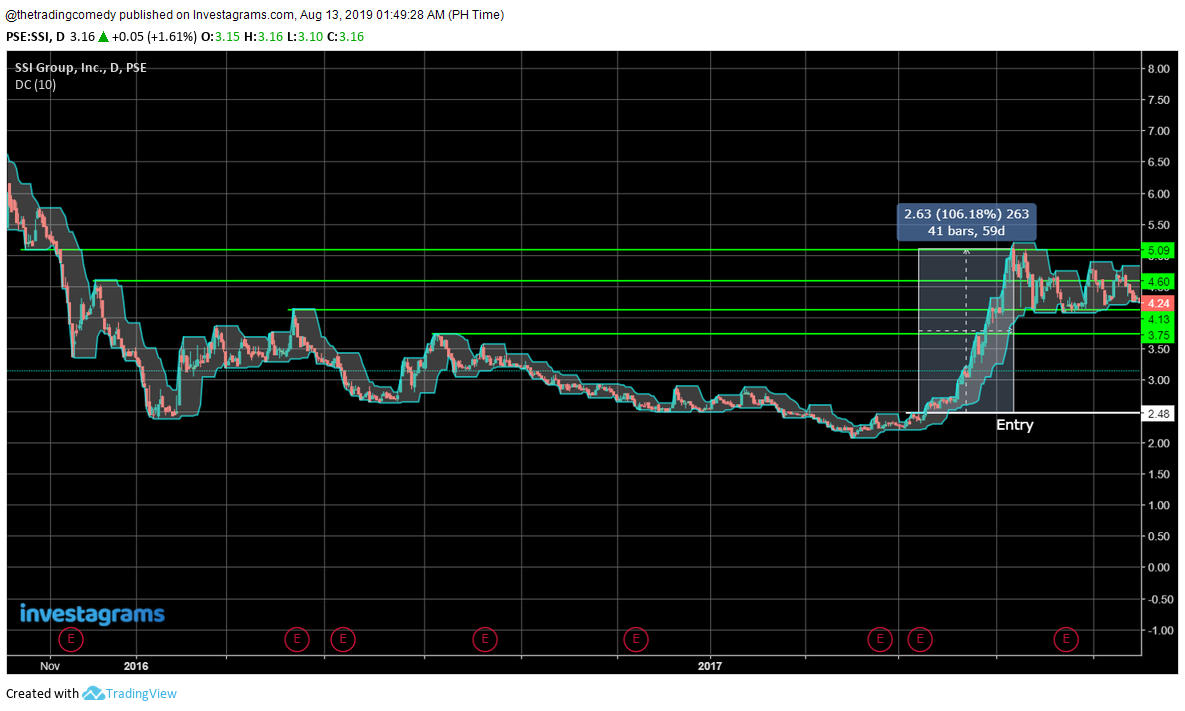
100+% in approximately 2 months? Wow 😅
Trust me, you’re going to back test like crazy after reading this.

There are some indicators that you can combine with the Donchian Channels that can give you some solid setups but I will leave that for another post.
If this is already enough to get you exploring, then good luck in finding your own holy grail setups.

Your Trading Poet,
Alex Corner
