
Greetings Trading Poets!
Today is another new year and for this post I’ve decided to share to you a technique that I discovered around last quarter of 2019.
We will be talking about Elliot Waves!
I understand why some people don’t want to use this to forecast price movements since it’s very tiresome to do in the long run so before reading through this blog post, I suggest you read some of the basic concepts of Elliott Wave Theory or watch this video before continuing on (and I hope you get to appreciate this post after watching):
a big help in your trading journey.
(Start @ 1:35 to find out why it is tiresome to do the “usual”)
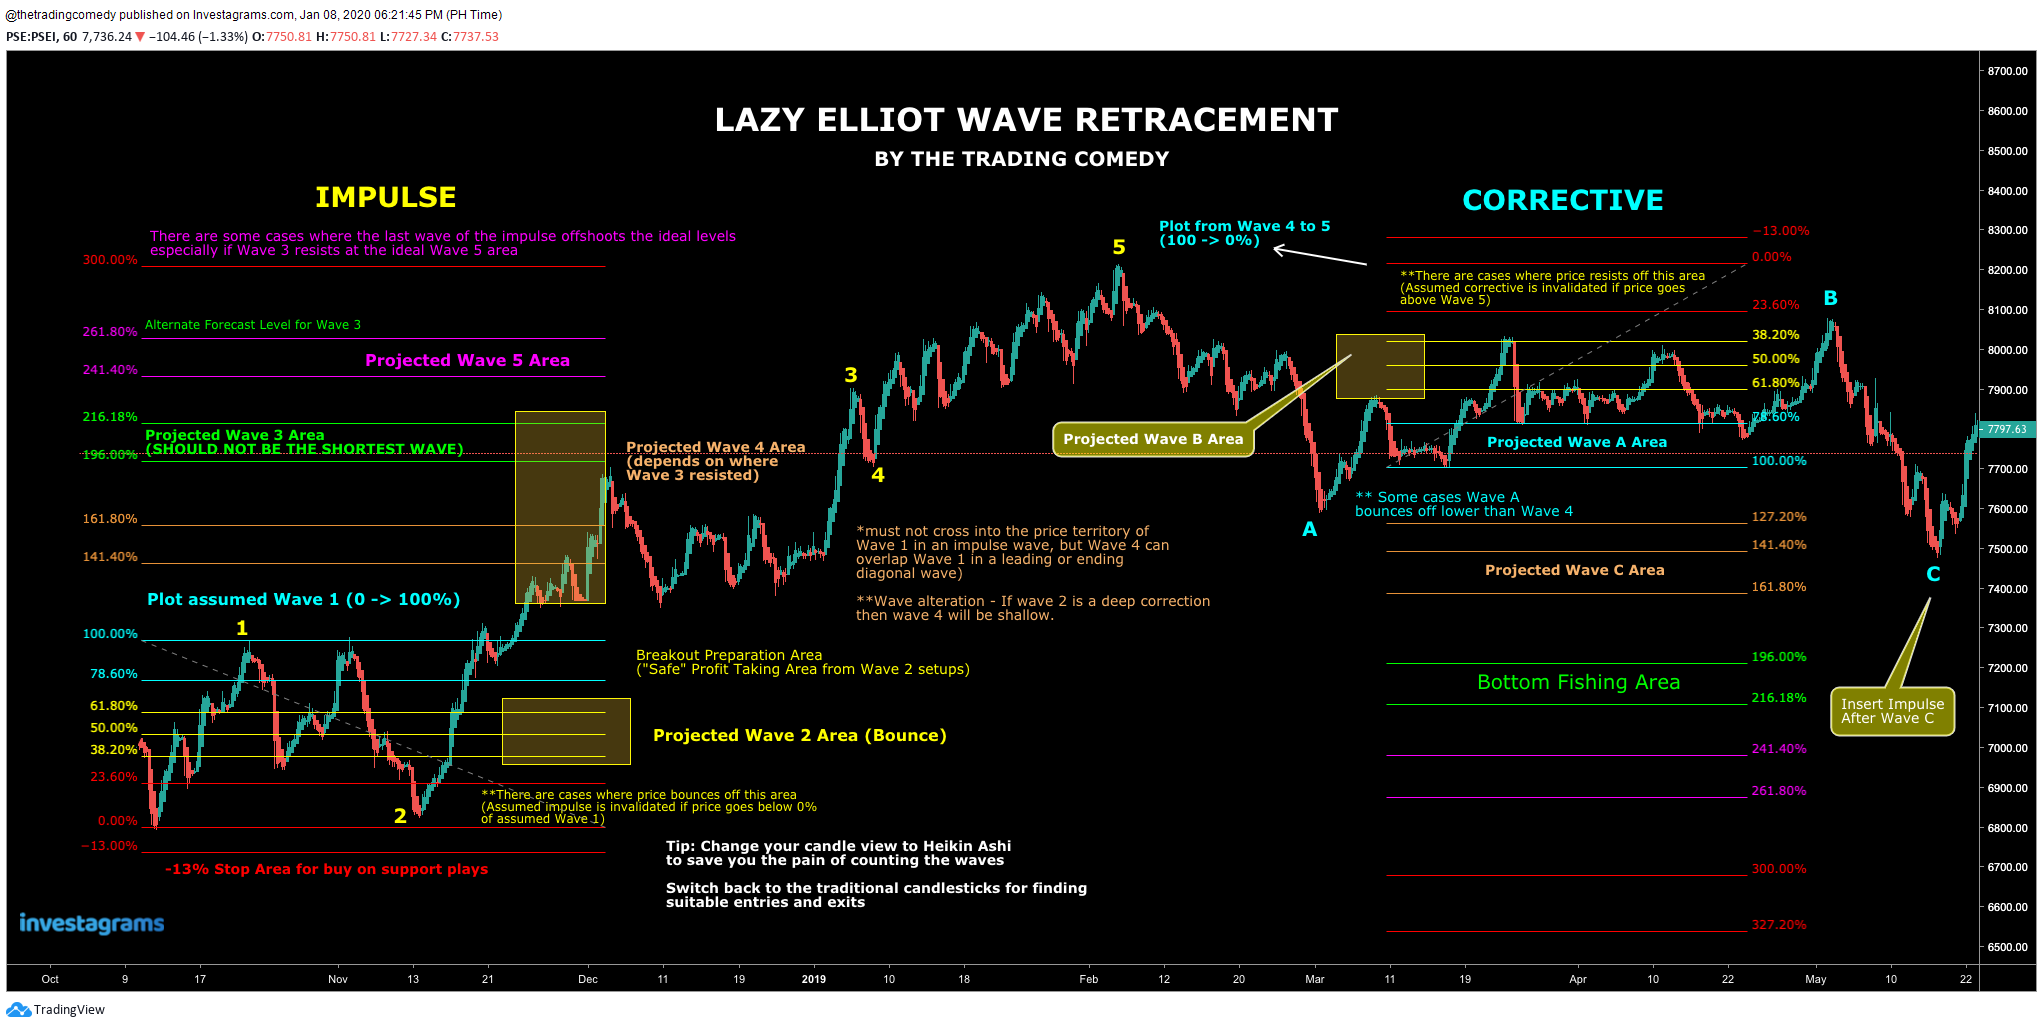
Here’s what an Elliott Wave cheat sheet usually looks like:

Assuming that you have read at least the basics of forecasting price movement using Elliott Theory, you will find plotting the Fibonacci retracements tend be tedious in the long run (not to mention if you get the counting wrong, you would redo the entire thing again and again!)
So after implementing this cheat sheet for a few months, I got tired of doing this over and over, I had some sort of “Aha” moment.
I remembered this quote that I read (a lot of sources said it was Bill Gates who said this):
“Choose a Lazy Person To Do a Hard Job Because That Person Will Find an Easy Way To Do It”
And it got me thinking that yes, the cheat sheet works and with enough practice I got to somewhat forecast the prices correctly but there must be a more efficient way to forecast waves without drawing a lot of retracements just to verify that the waves are “correct”.

It took me a few months to discover this but I am proud to say that this custom retracement solved all my forecasting headaches!
Yes trading poet! You read that right. Regardless of what type of wave you want to look at, whether it be an impulse or a corrective wave, all you need is ONE RETRACEMENT to give you the projected forecast of the entire movement of a candlestick chart!
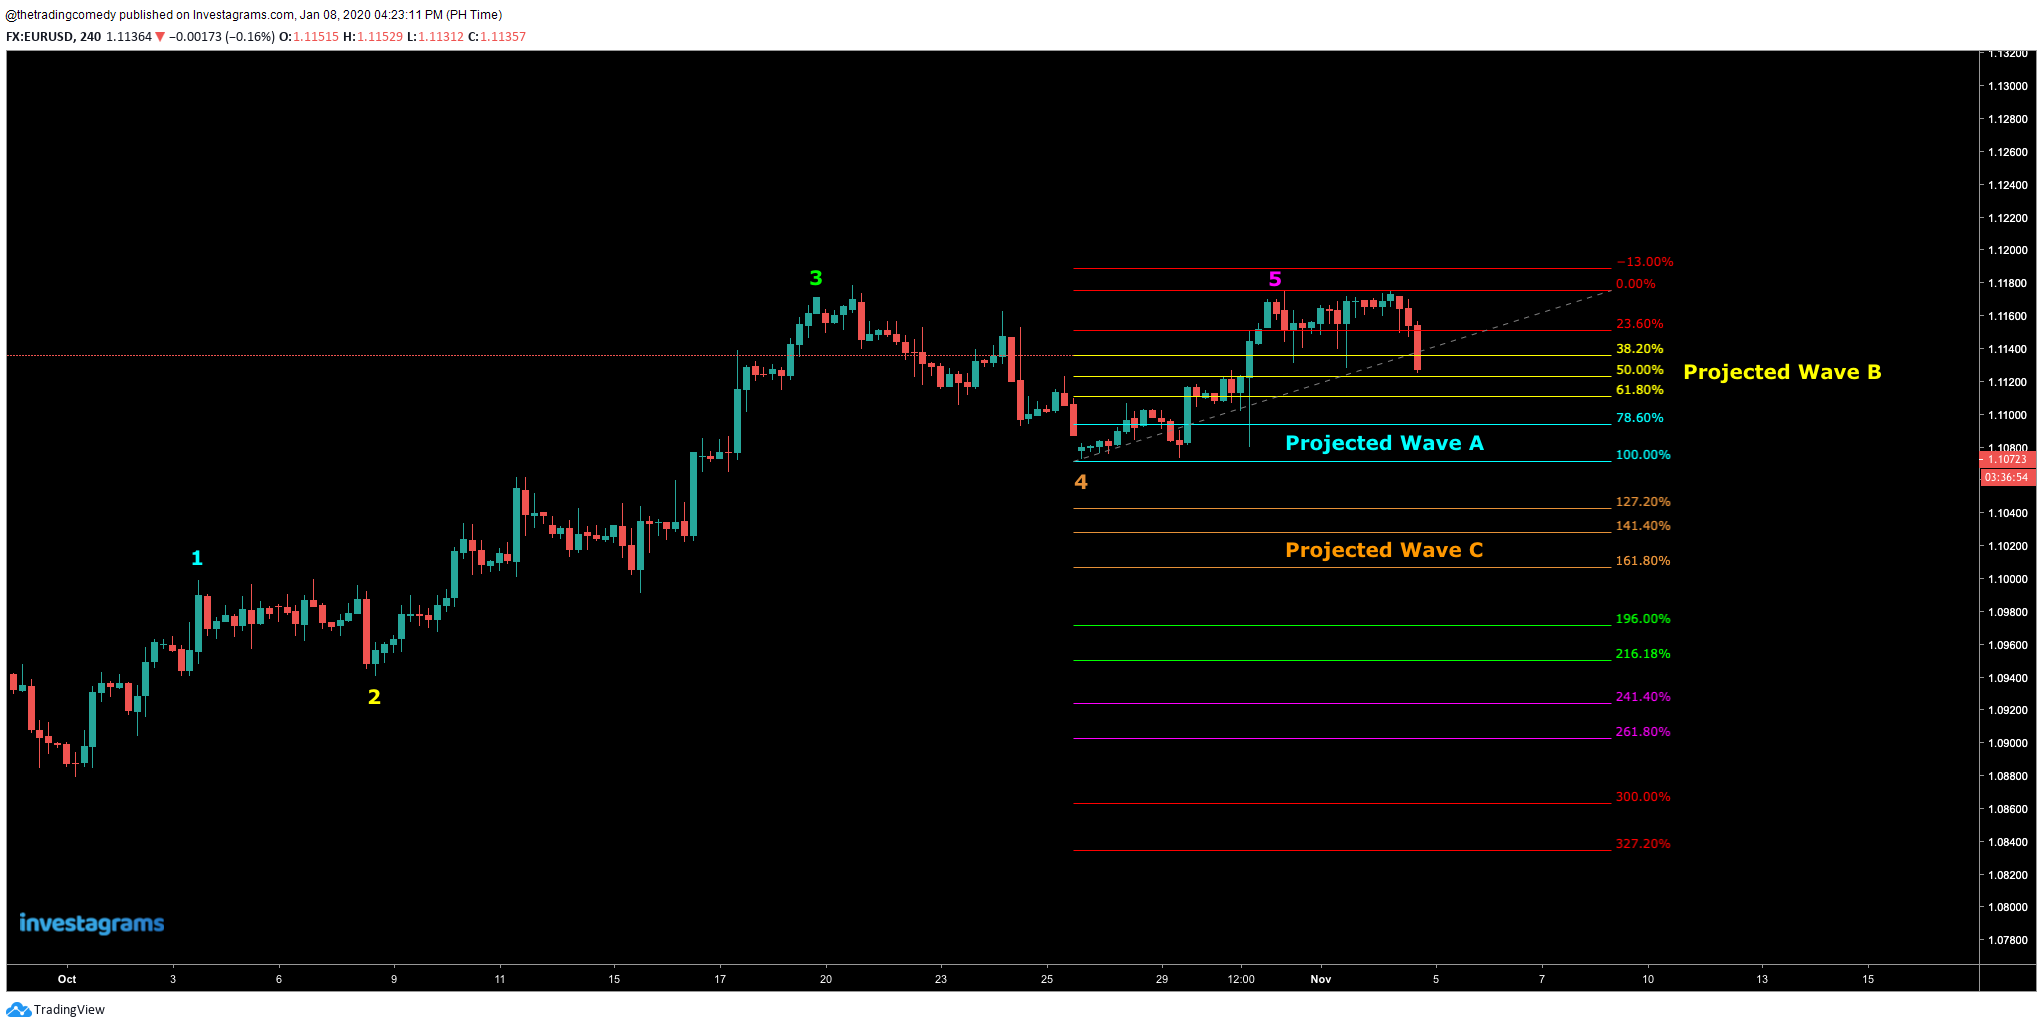
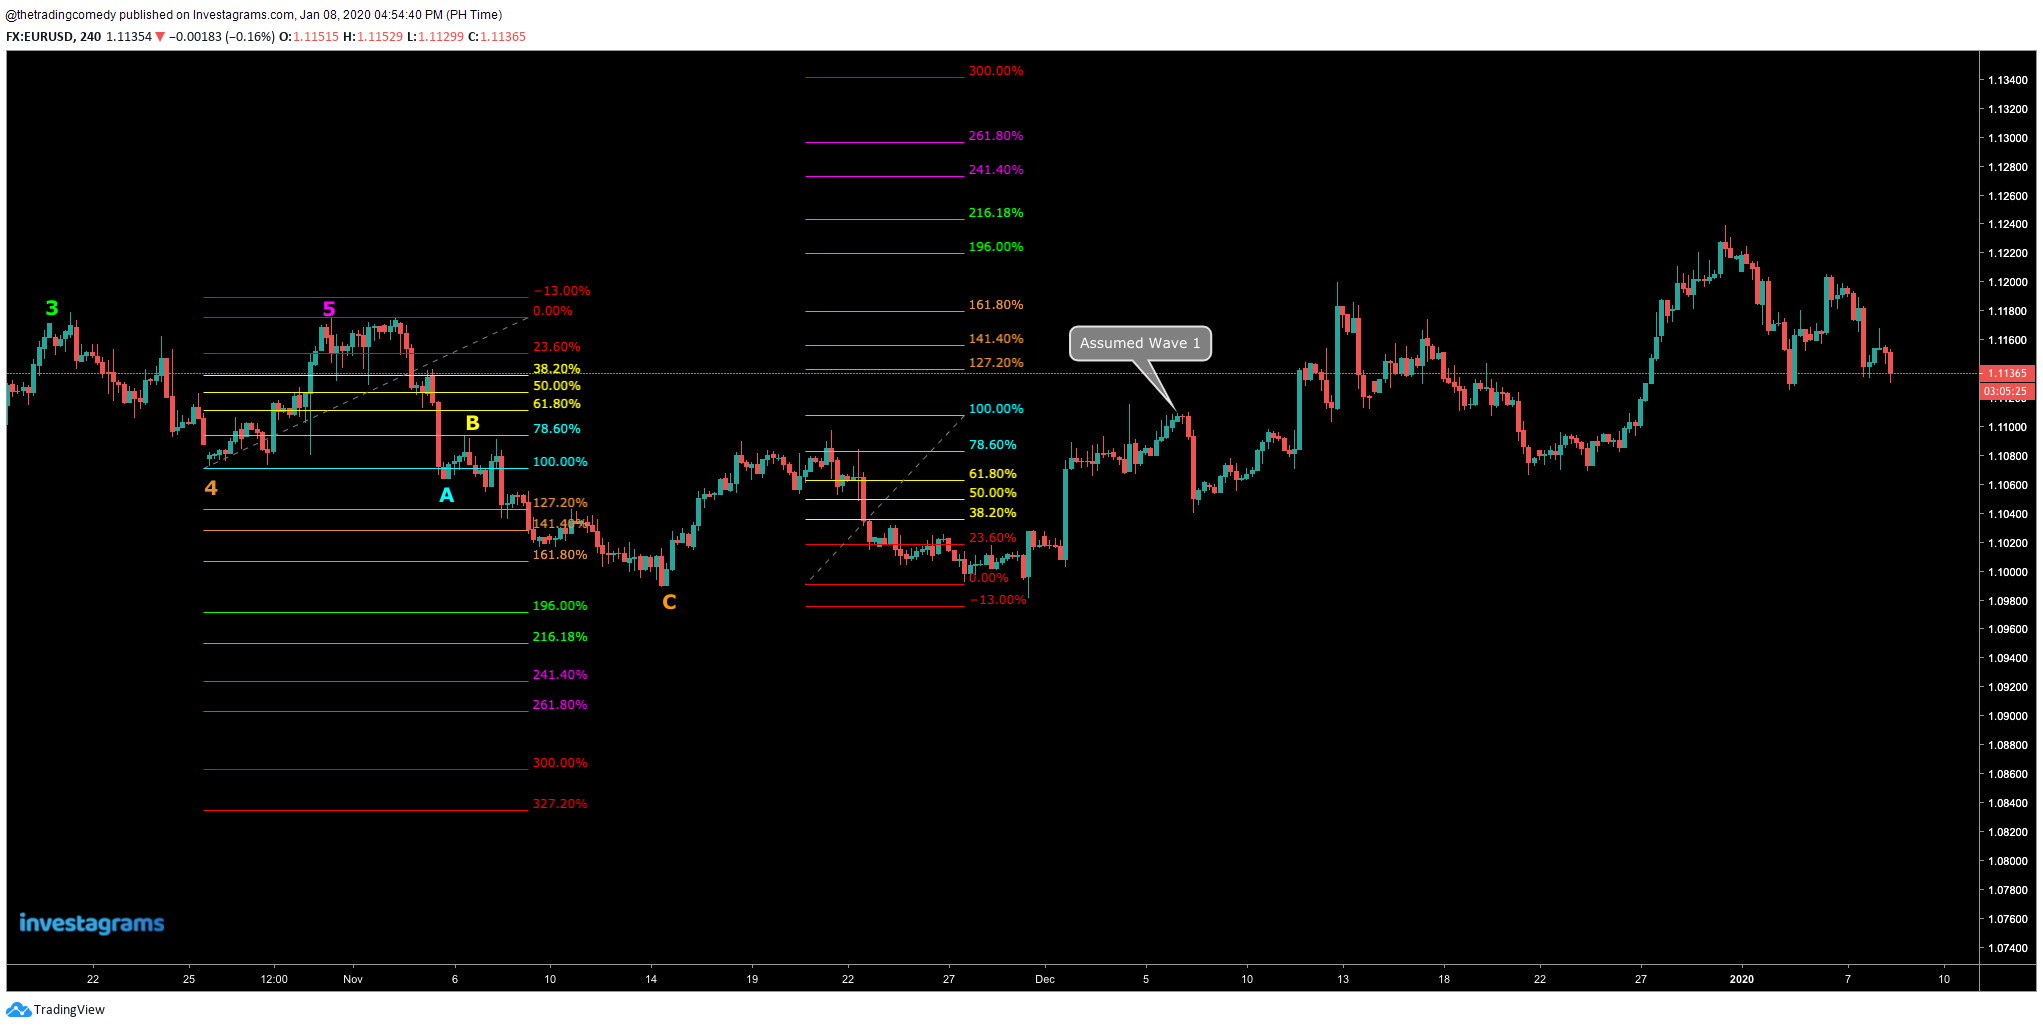
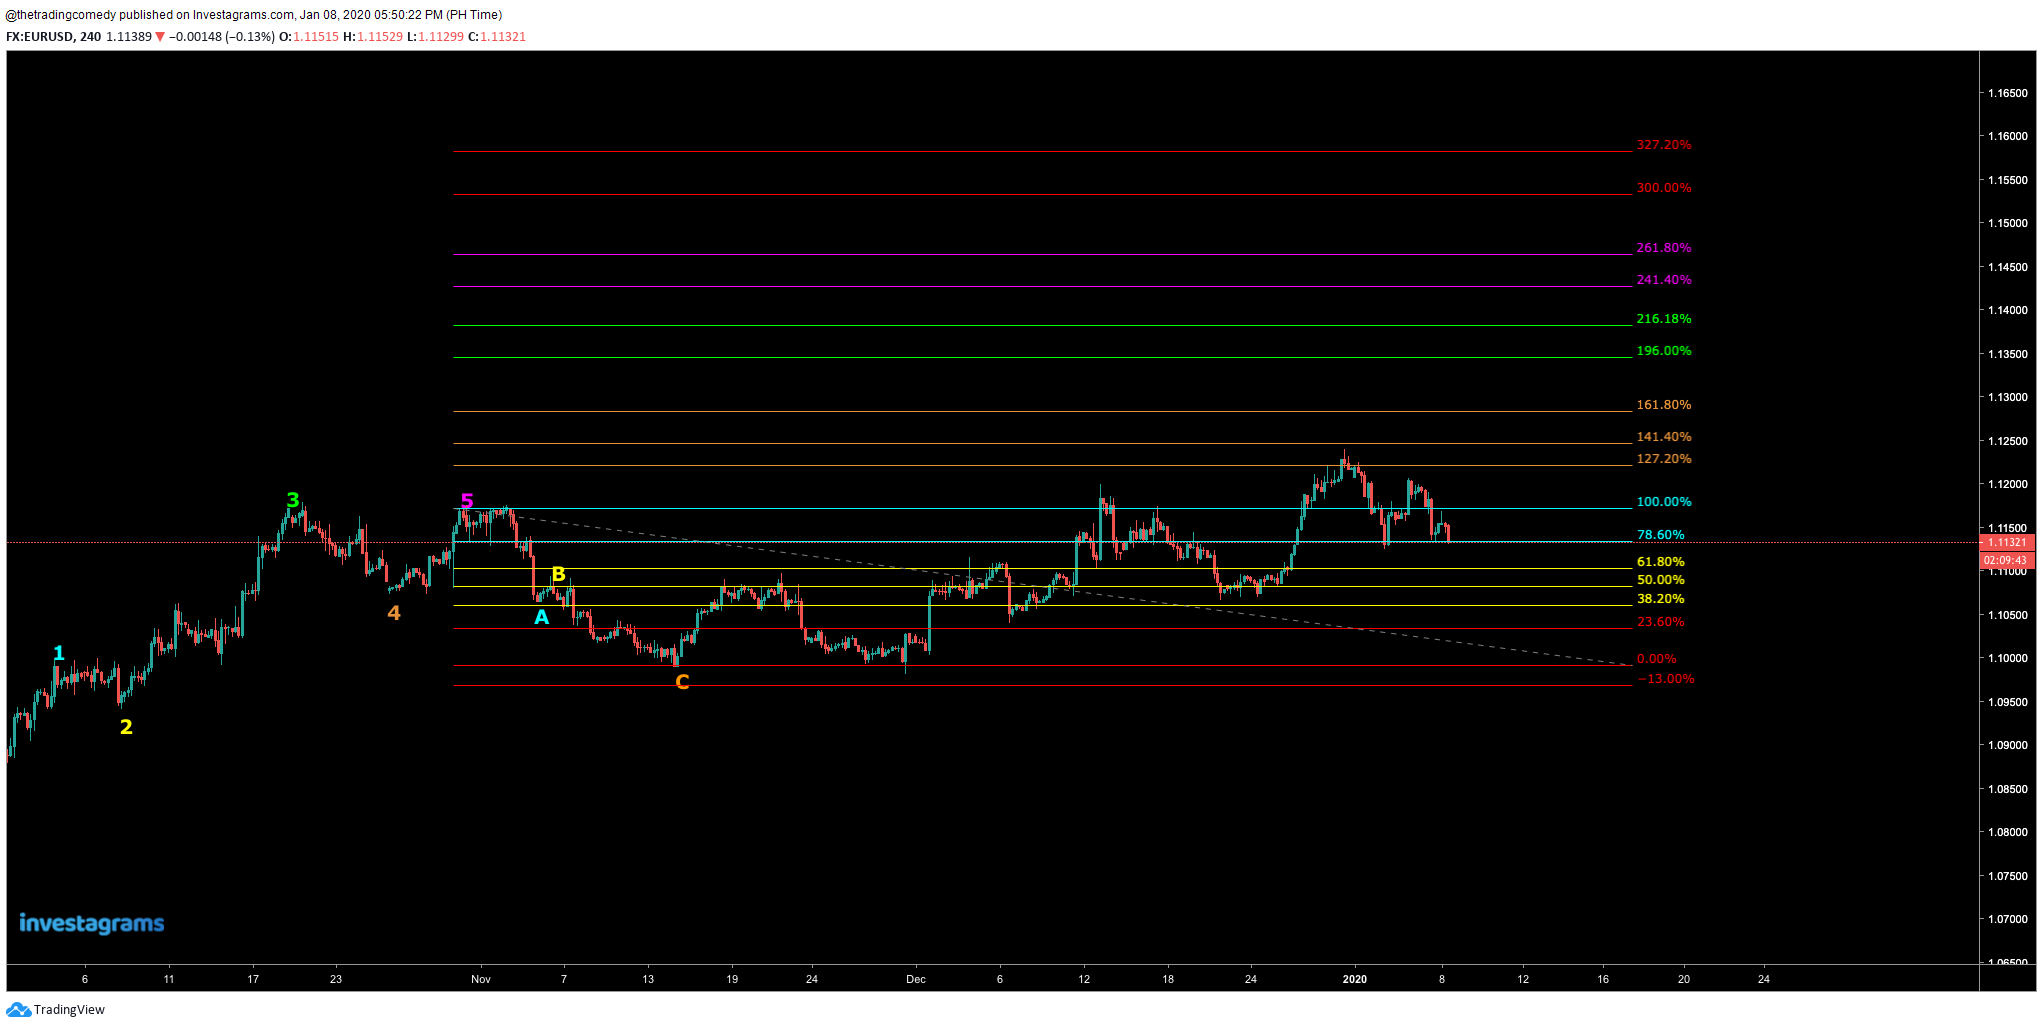
Let’s check out this example. Say you’re looking at a Forex chart and you assumed that you’re looking for an impulse wave and you want to know where Wave 1 and 2 is:
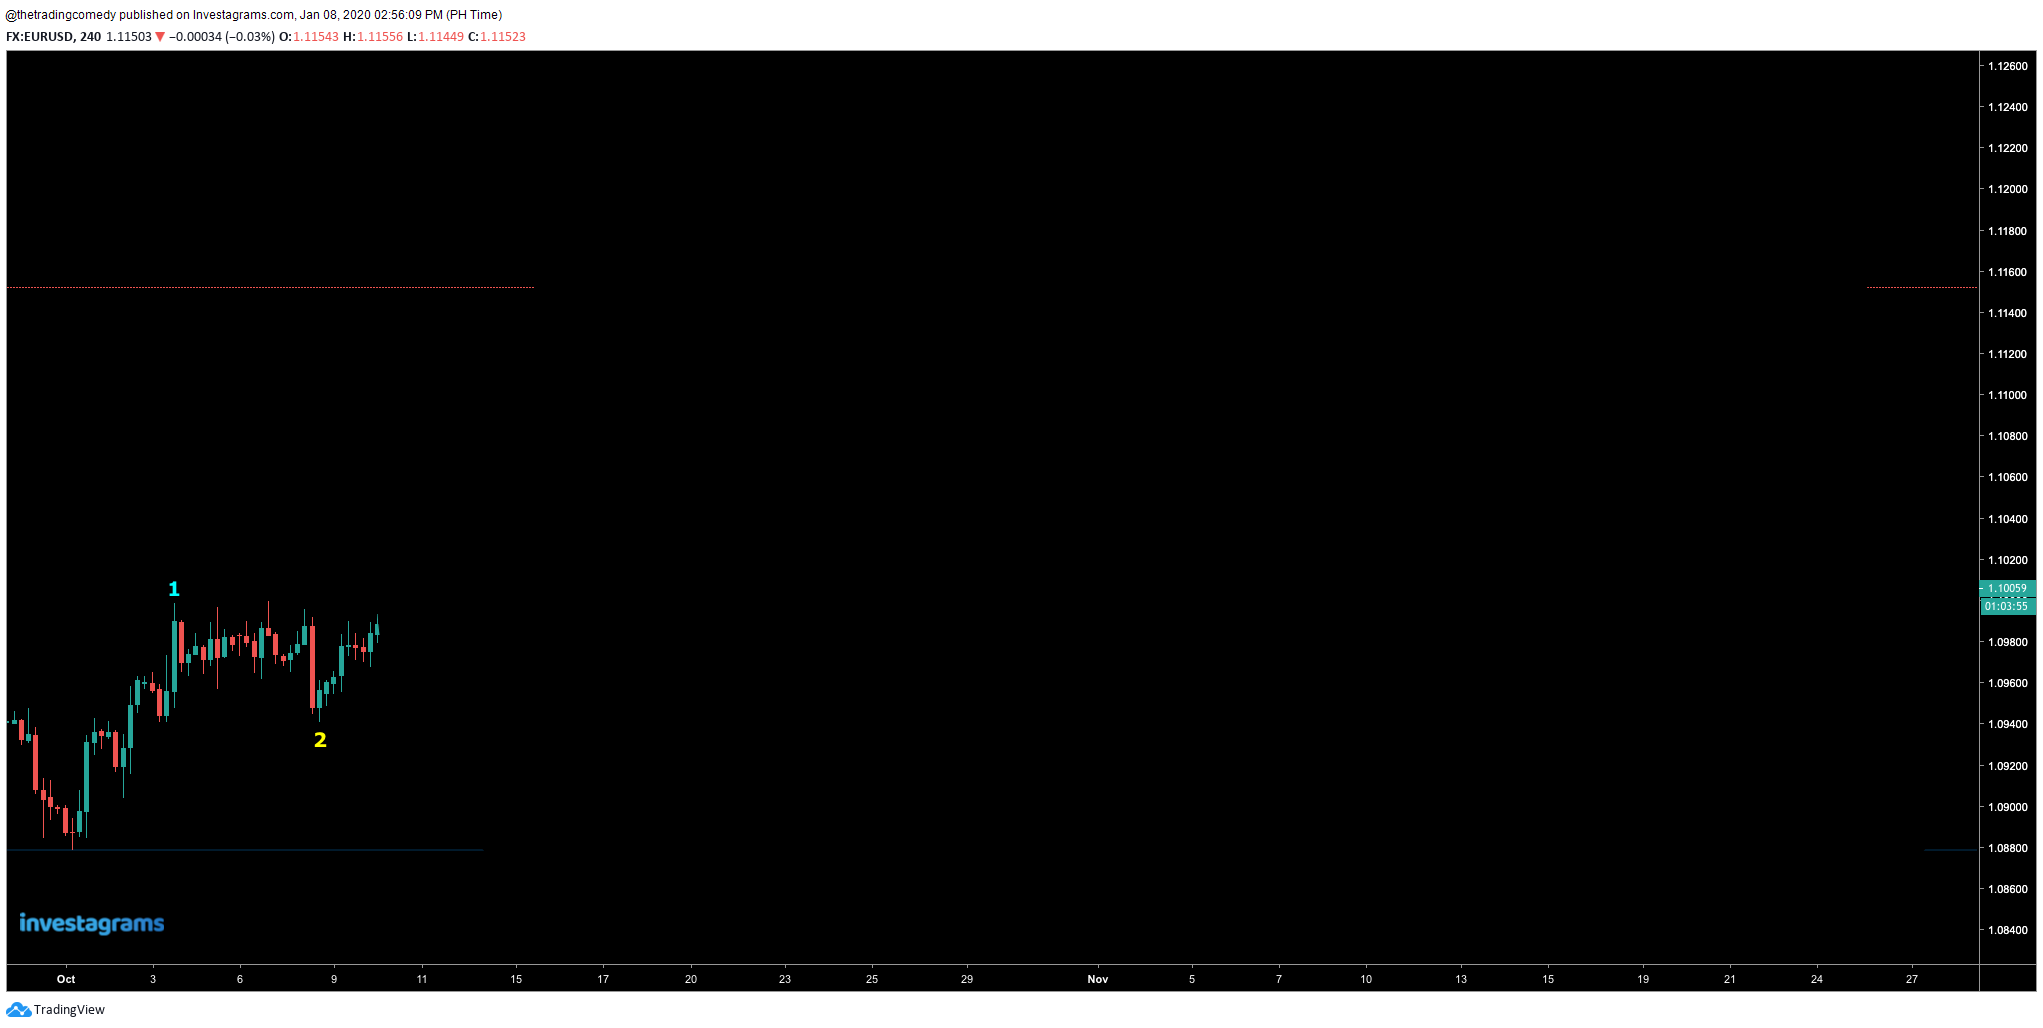
Like I said, we only ONE RETRACEMENT to forecast the entire impulse. Let’s apply it right now…
I know what you’re thinking right now. You must be like…
“How the f*** did he know that the prices would hit those areas?? “
“He’s insane!“
“No way in hell those prices will hit on those assumed levels!“
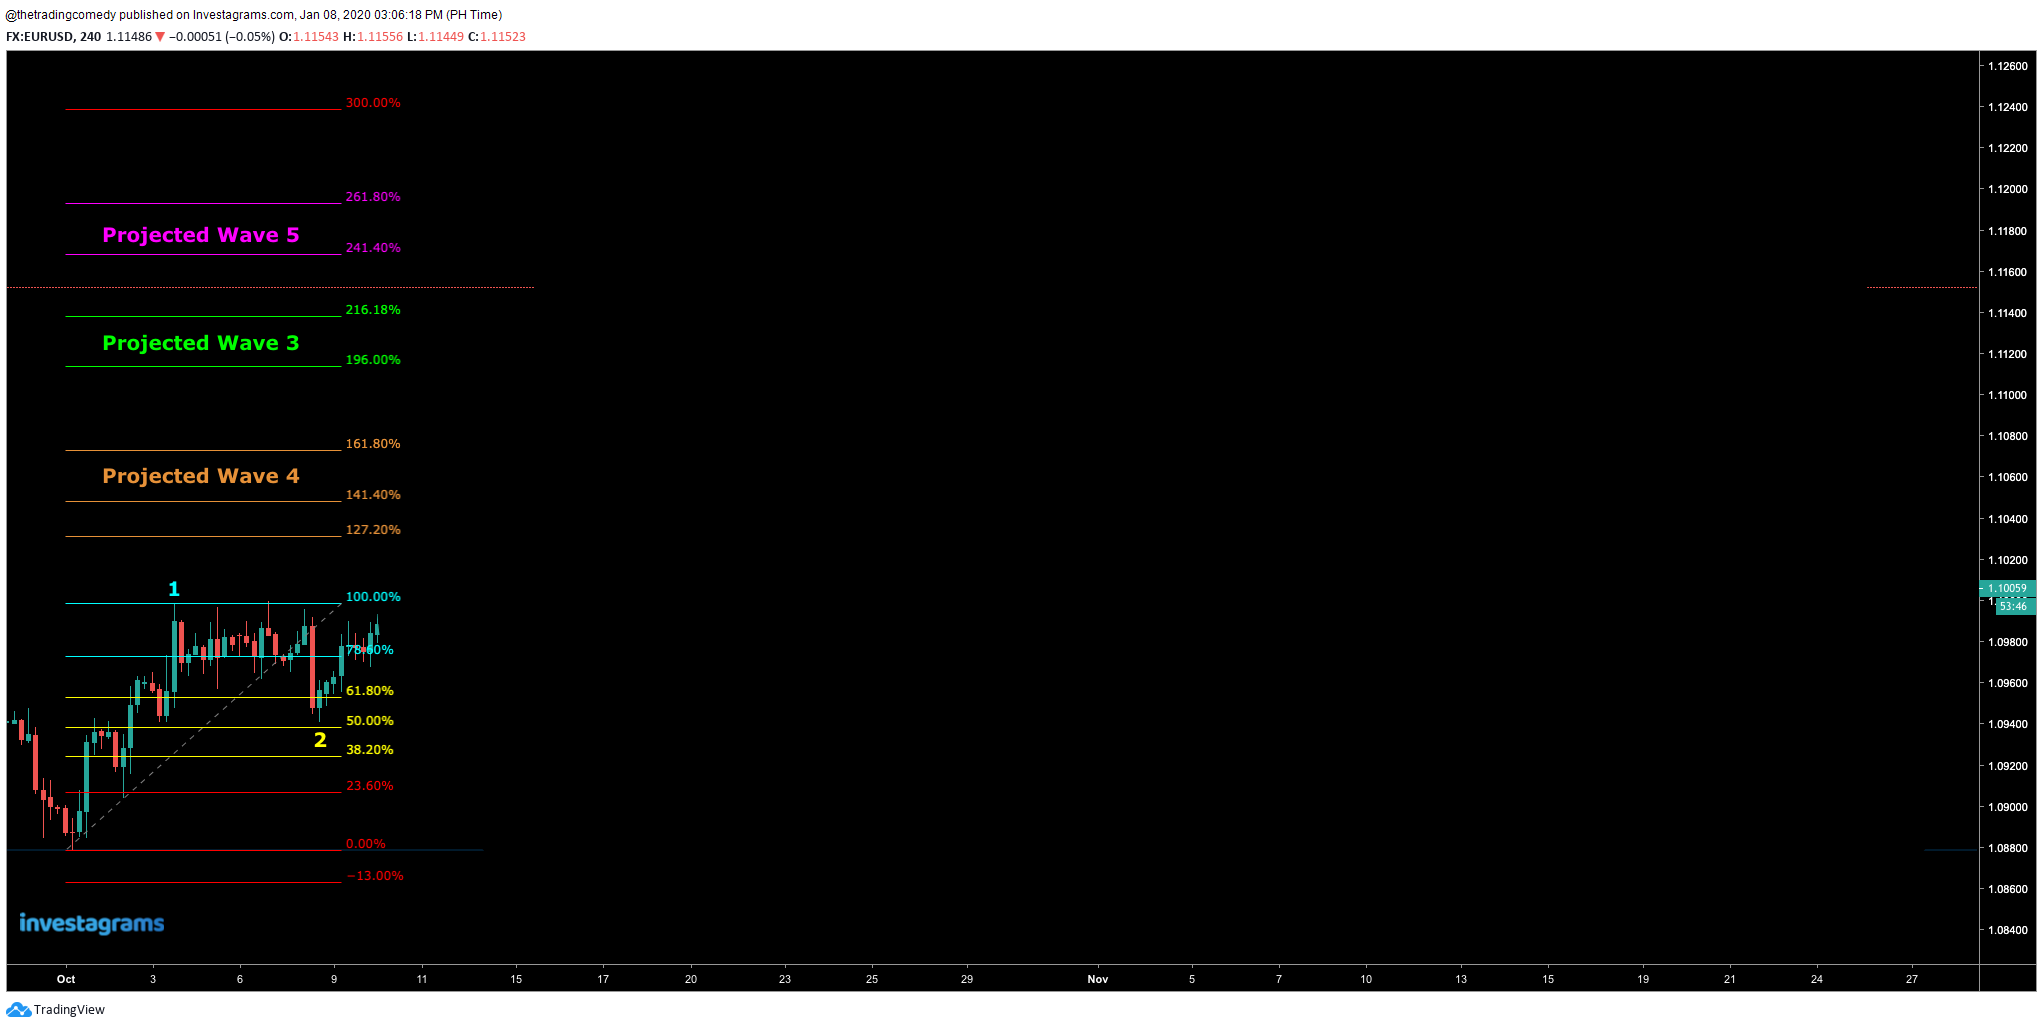
Alright! Let’s see where the prices actually went…
Oh would you look at that! The prices actually hit our projected levels based on ONE RETRACEMENT.

Some of you might think that Wave 5 is not done yet, which is actually understandable, since the ideal end of an impulse wave is Wave 5 should be at least above Wave 3.
What we actually encountered here is an impulse wave with a truncated 5th if that’s the case.
Oh where are my manners? This is the part where I tell you on how to actually plot this. 😂
So let’s start with the retracement first.
You may want to set your retracements this way:
Fibonacci Retracement Settings
It is highly recommended to put a color coding scheme for your levels so that you immediately have an idea on what wave your current forecast is in.
Here are the ideal color groups for each Fibonacci Level (again you can use your own color coding scheme, it’s just a matter of preference, really):
Wave 1: 78.6% – 100% (An entry area for breakout plays; Conservative profit taking also happens here if you entered from a bounce)
Wave 2: 38.2 – 61.8% (An entry area for bounce plays; you could also use this area for conservative profit taking if you entered from 0.00, which rarely happens, to 23.6%)
Wave 3: 196 – 216.18% (Aggressive profit taking levels; this is usually the LONGEST WAVE but not the SHORTEST)
Wave 4: 127.2 – 161.8% (Conservative profit taking levels if you entered from Wave 2 or the breakout of Wave 1; 161.8% can also be a profit taking level if you observe the price bounces off 38.2%)
Wave 5: 241.4 – 261.8% (Usually where the wave ends; Additional profit taking level if you entered from Wave 4; you would usually support this level with an oscillator divergence, if necessary)
The only step you need for drawing the retracement is this:
FIND THE ASSUMED WAVE 1: Plot the retracement from top to bottom (0-100% Levels)
That’s all really, no more no less. If you’re new to reading price charts and you want to be more accurate in your forecasts, I suggest you wait for a Wave 2 movement until it creates a clear support level.
The only time your assumed Wave 1 becomes invalid is that if Wave 2 goes below your assumed Wave 1 (0.00%) Re-draw the retracement if that happens.
Here are some guidelines as well when you’re forecasting an impulse retracement:
- There are rare cases when Wave 2 bounces off 23.6%; adjust your projected Wave 3 up to 127.2% and use 161.8% as a bonus level or use the default projected area of Wave 3.
- There are also cases where Wave 3 can extend up to 261.8% so adjust your projected Wave 4 to where Wave 3 is usually projected (196 – 216.8%) or you can use the default projected area of Wave 4.
- If Wave 5 extends beyond 261.8%, you can use additional Fibonacci Levels (e.g. 300 – 361.8%) for your projected end wave.
Now let’s proceed on how to forecast the corrective retracement.
Just like the impulse retracement you only need to do one of these steps
FIND WAVE 4 to 5 OR WAVE 5 to A: Plot the retracement from bottom to top (0-100% Levels)
Let’s go back to our example and plot it right now.
Like I said a while ago, putting color coding schemes to your levels will save you a lot of time in planning your trades. So here are some levels to take note of when looking at a corrective wave based on this retracement:
Wave A: 78.6% – 100% (If you’re lucky and you got Wave 5 right, you can actually use this level to take profits if you shorted this)
Wave B: 38.2 – 61.8% (Bounce area for the next short)
Wave C: 127.2 – 161.8% (Where the corrective wave usually ends; 161.8% can also be considered as a “Dead Cat Bounce” level if you observe the price bouncing of the Alternate Wave C instead of this one)
Alternate Wave C: 196 – 216.18% (If for some reason the price aggressively breaks down, this could be an additional area for profit taking when you’re shorting. This level can also be used to plan bottom picking plays)
Here are some guidelines as well when you’re forecasting a corrective retracement:
- There are rare cases when Wave B bounces off 23.6%; the default projected area can still be used to forecast Wave C (it usually resists at around 127.2 – 141.4%, so treat 161.8% as an offshoot level)
- If the price bounced off from the Alternate Wave C and resisted from the ideal Wave C levels (127.2 – 161.8%) you might be looking at a reverse impulse move instead of a corrective move (or a dead cat bounce if you redraw the retracement from Wave 5 to Alternate Wave C top to bottom)
- If the price broke out from the ideal Wave C levels and resisted to the previous Wave B or Wave 5 level, you might be looking at another impulse move in the works. You can draw the impulse retracement (top to bottom) from 2 perspectives:
- From Wave B to Wave C
- From Wave 5 to Wave C
- Pray you won’t get bashed by other financial analysts from forecasting the reversal (especially if you get it wrong 🤣)
Now let’s see where the price went…
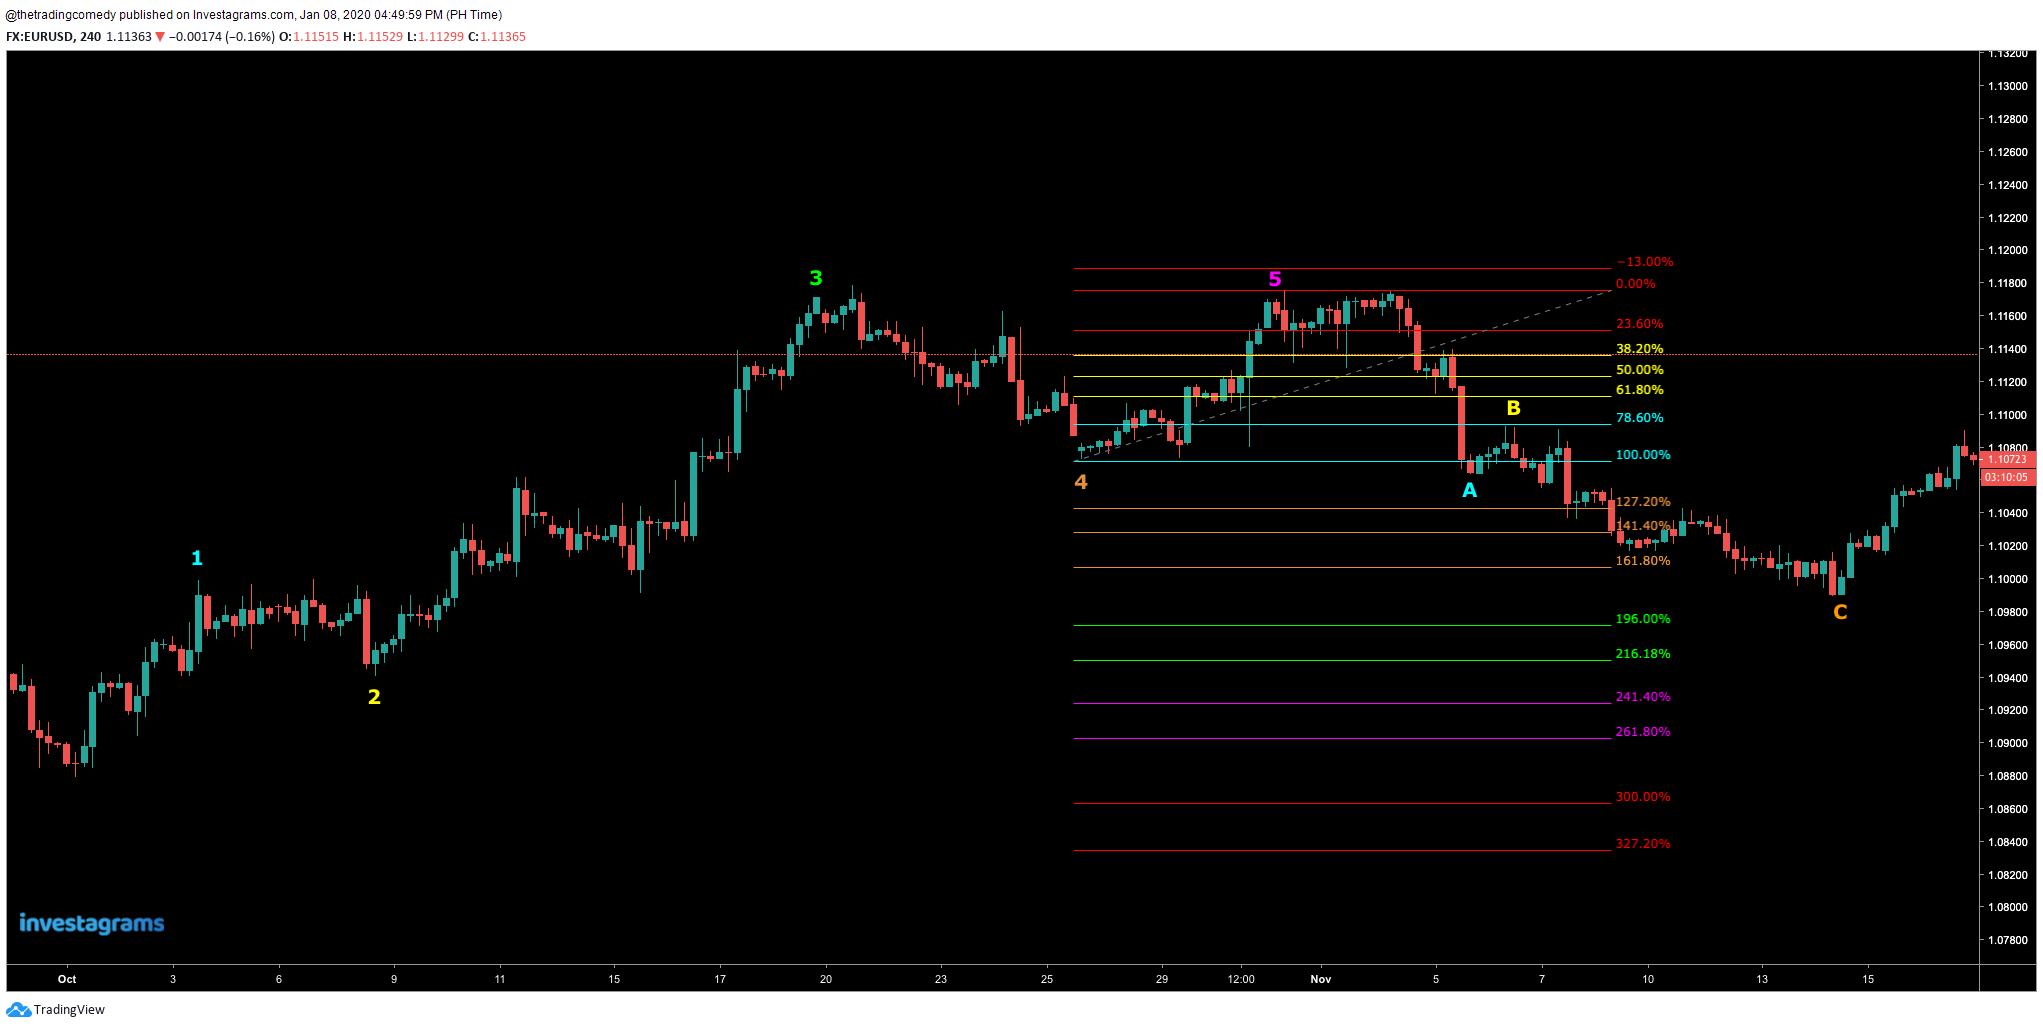
So let me guess, the next move would probably be an ongoing impulse wave assuming that forecasted Wave C holds (but with the tensions going on in the US the price chart might paint the picture differently)
Or if you want to look at it from another angle…
Looking from this EURUSD chart, we can see that the price might continue to go down to the Wave 2 area. Now you see why I encourage to use different colors for the levels because you can see the technical narrative clearly (if you can incorporate fundamentals to this chart, even better)
Anyway, I’m saving the trade setups for another post (I actually applied this already in some of my real trades, you can check it out on my Facebook page) but for the seasoned traders reading this post, I kinda gave away the levels you need to watch out for, if you read between the lines. 😆
This is enough for you guys to get started in forecasting your charts and hopefully discovering magical trade setups that you could do along the way.
I’m pretty sure after reading this entire post, you will never look at Elliot Waves the same way again. 🧐
Happy backtesting!
P.S. If what I explained in this blog post is still not enough, then grab these cheatsheets and save them (and thank me later if this method saved your trading career as I’m currently saving mine 😂)
Watch the video below 😁
For traders based in the Philippines, feel free to subscribe to InvestaPrime here.

Leave a comment