A lot of trading resources nowadays are so obsessed with candlestick chart patterns and strategies that they tend to neglect this type of chart and it’s also the simplest to look at.
What if I told you that all you need in trading the markets especially if you are counting basic Elliott Waves is actually a line chart?
One thing that I realized while plotting my Lazy Elliott forecasts using this retracement is that whenever I use the candlestick chart view, it can be prone to misconceptions.
Other analysts may critique your wave count telling you that it’s not valid but in fact it is!
Let’s take a look at this example:
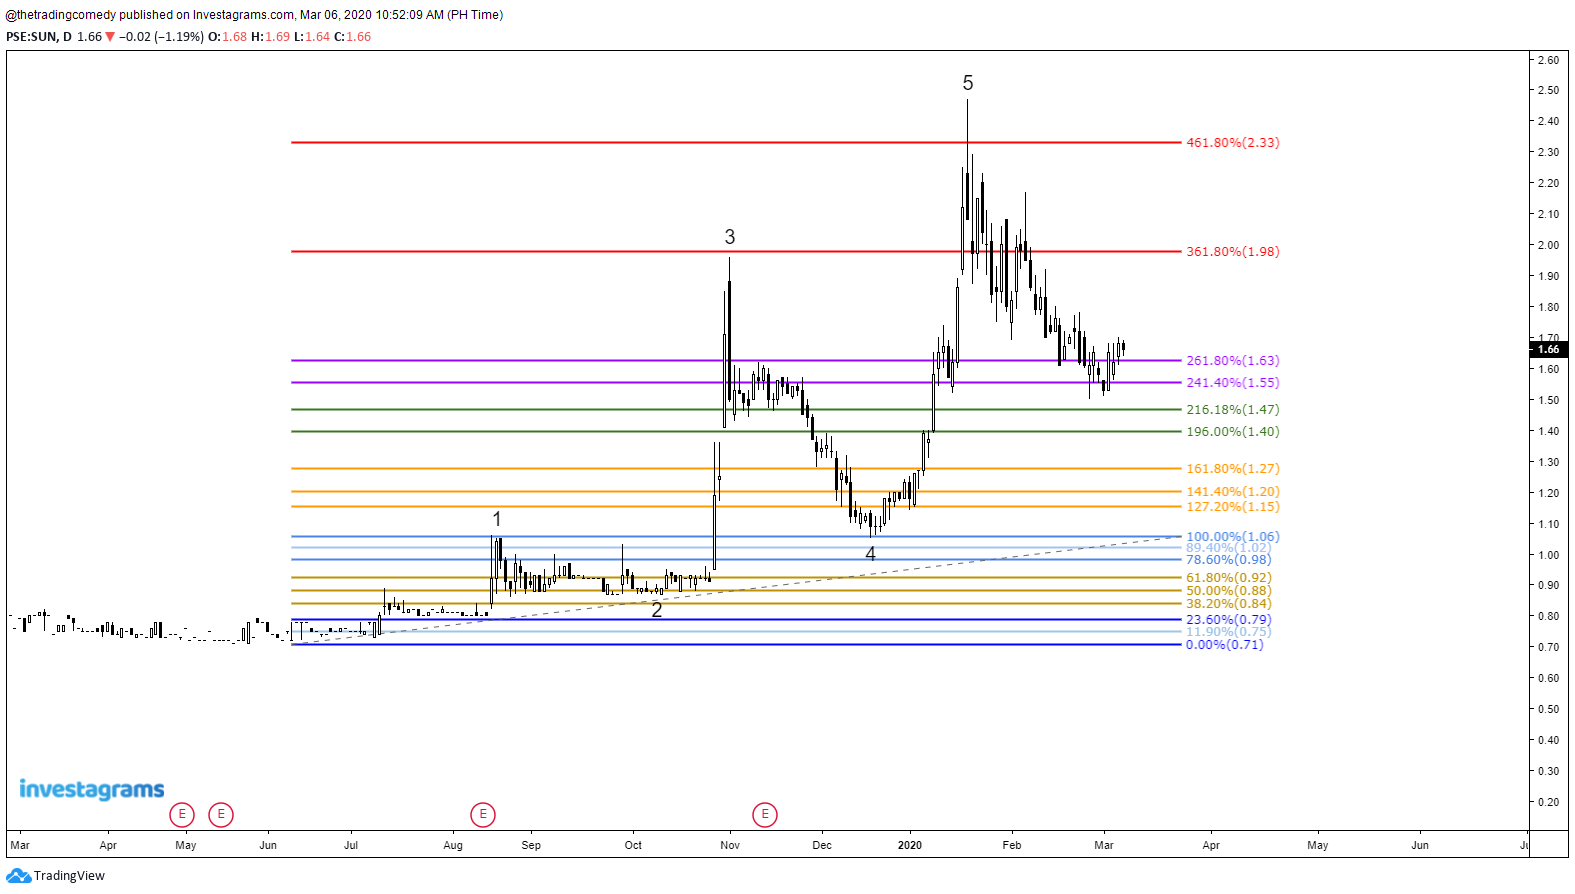
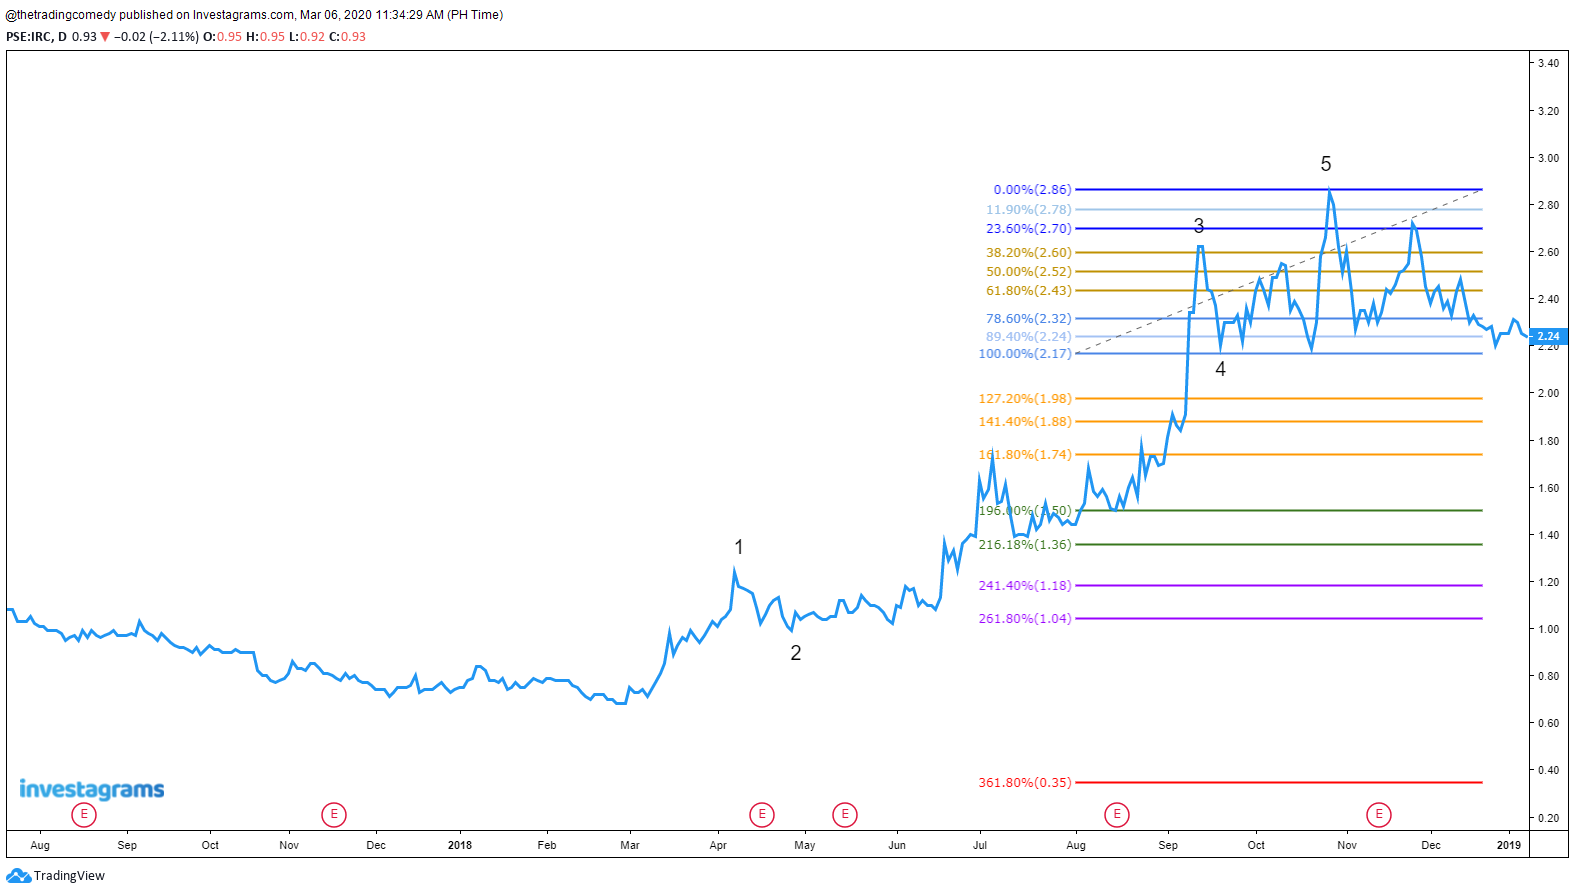
I understand that some of you might say that it’s not a valid count at first glance because one rule in counting an impulse wave is that Wave 4 cannot overlap Wave 1.
This example can be misleading to others because they are thinking just because the label overlapped or the price visited the area of Wave 1 they will conclude that it’s not a valid count.
But what happens if we switch it to a line chart:
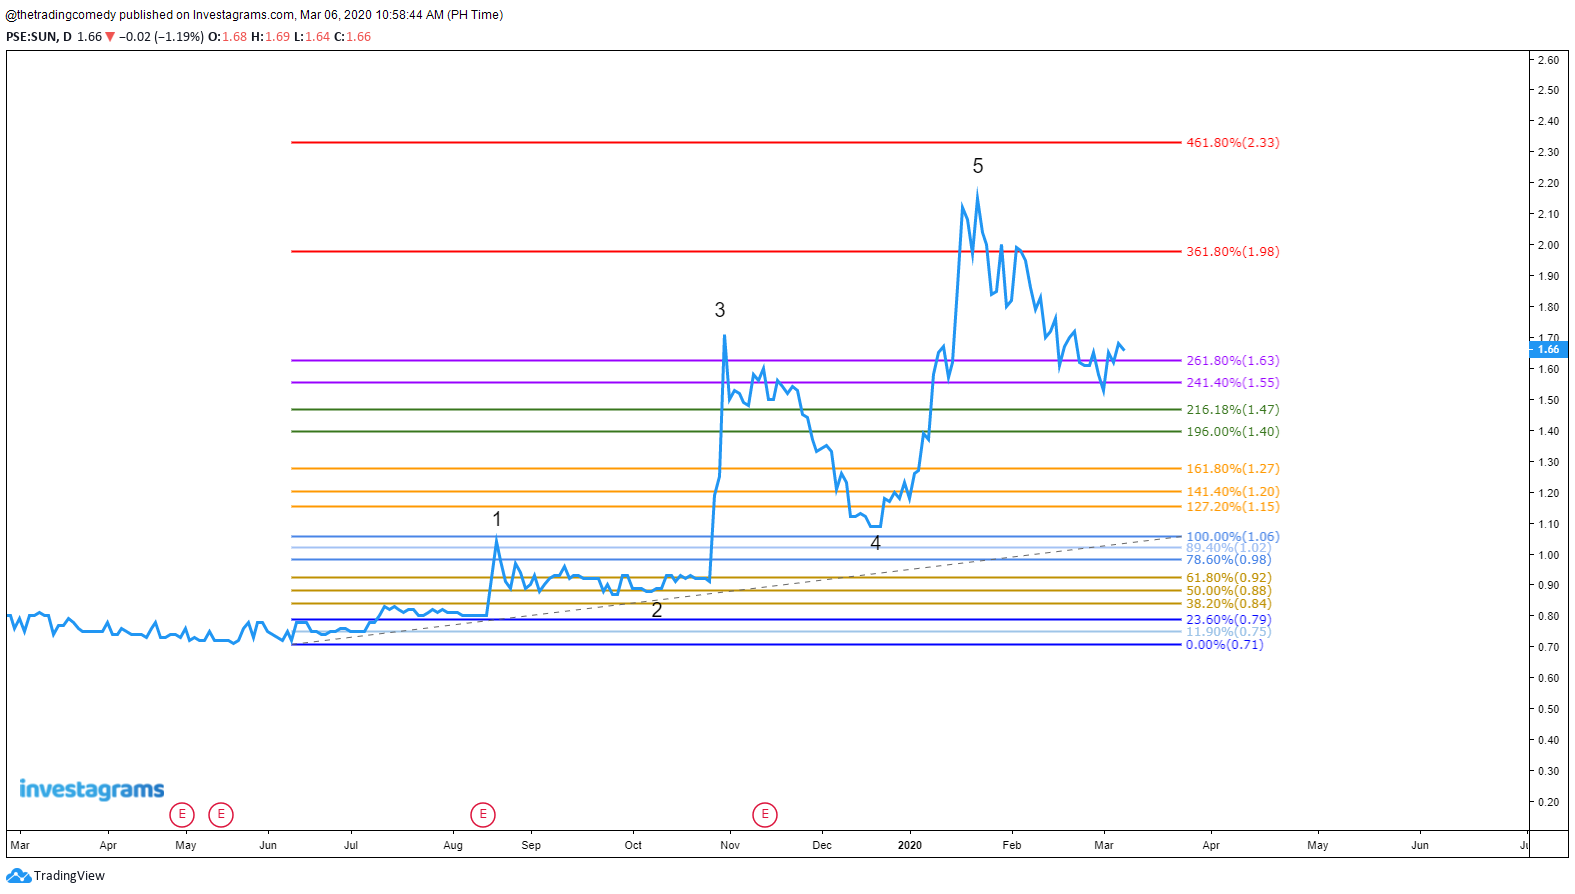
This is where the saying “price is king” applies. As you can see, when switching to a line chart view, your only concern are the closing prices. Look closely at the chart again, clearly you could see that there is no overlap!
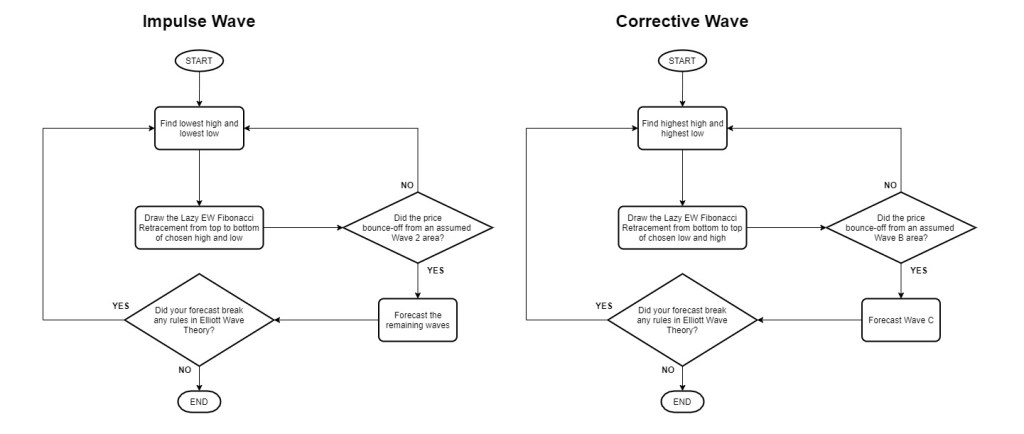
So as Lazy Elliotticians, how can we plot the retracement on a line chart and use it to our advantage?
For spotting an Impulse Wave:
- Find the lowest high and the lowest low that you could find.
- Draw the retracement from your chosen high and low from top to bottom.
- If you see the price bounced off an area of Wave 2, it is a qualified lazy plot.
- Count/forecast the remaining waves.
- If you observe that your forecast is breaking an Elliott Wave rule, go back to Step 1.

As for the remaining waves, there are a couple of ways to count this.

For spotting a Corrective Wave:
- Find the highest high (Assumed Wave 5) and the highest low (Assumed Wave 4) that you could find.
- Draw the retracement from your chosen high and low from bottom to top.
- If you see the price bounced off an area of Wave B, it is a qualified lazy plot.
- Count/forecast the remaining waves.
- If you observe that your forecast is breaking an Elliott Wave rule, go back to Step 1.
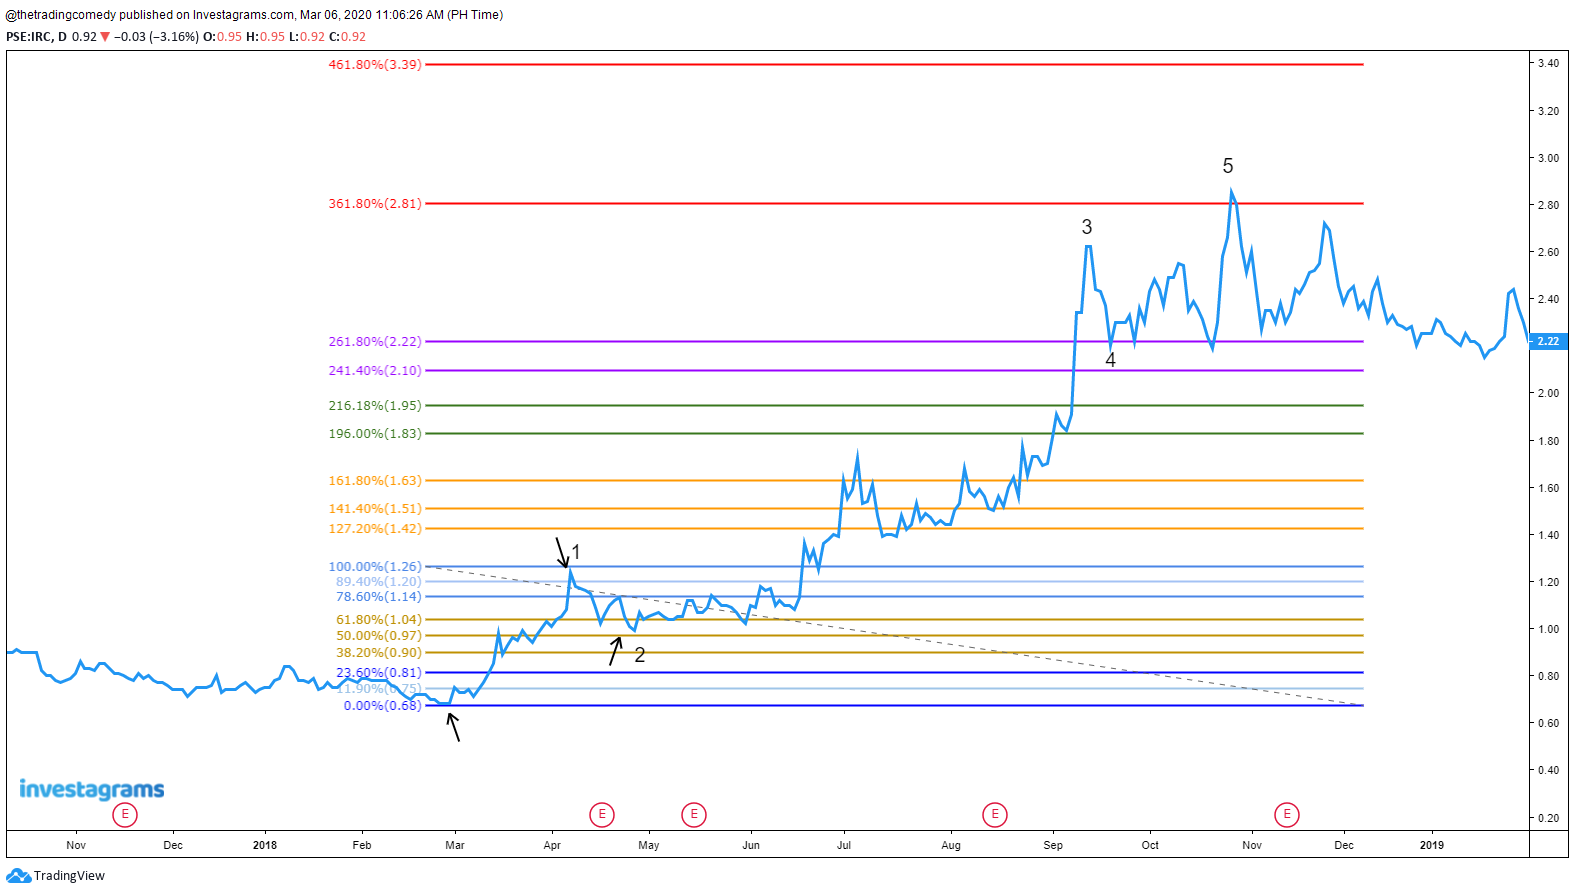
Let’s see where it will go. Usually the price should correct either up to 100% or up to 161.8% beyond, if it’s a deep correction.

You could’ve made a fortune if you shorted this but wait, I forgot that we’re in the PSE.
We don’t have shorting 😂😂😂
Usually when I see something like this, I would recount it especially if it breaks down 261.8%. You might want to rethink this chart and flip the wave order, like this:

You can do this in currency pairs as well depending on where your bullish bias is but I leave that to you.
And for the last step that applies to both impulse and corrective waves: consult another indicator (e.g. PSAR, Moving Averages, RSI) for your preferred trade setup, if necessary.
To summarize everything that you just read, here’s a flowchart. Now quit slacking off and start practicing!