Featured

A Poetic Approach to the Stock Market

Poetic? Isn’t the stock market about making money?

How is this poetic? Isn’t this just all about buying low and selling high? Where’s the art in that?

Well yes, but you know what? If I talk about the stock market in financial jargon, it would sound a bit boring and overwhelming. I don’t want you to get succumbed to the idea that the market will make you rich right away (and please don’t leave your day job yet for this involves a lot of time and patience to master, I’m telling you)

So with that said, let me give you different perspectives of what the stock market is. To make it super interesting to you, let’s actually relate the stock market to Dante Alighieri’s Divine Comedy because it is exactly what it looks like:

Welcome to the world of the stock market!

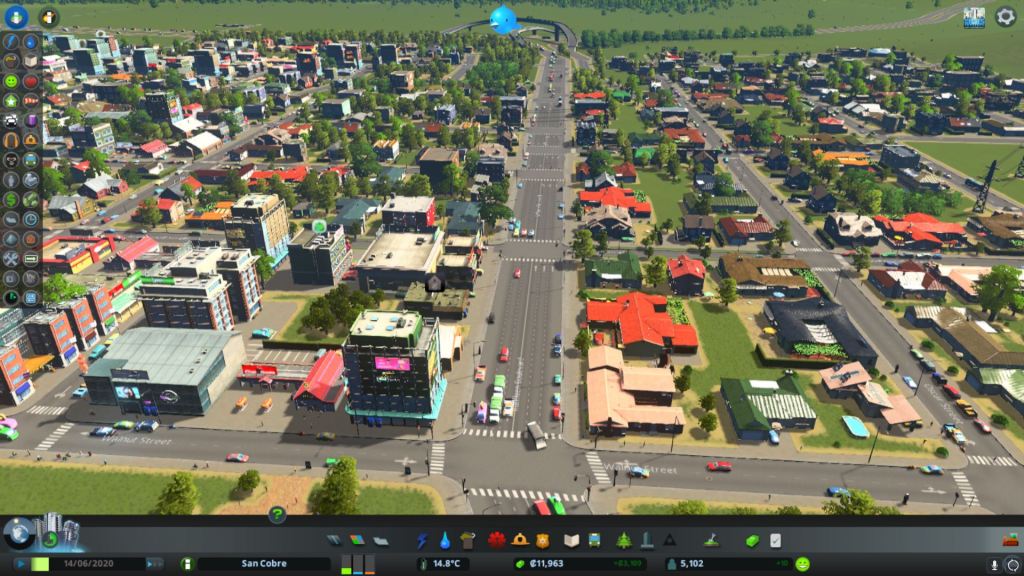
I know it sounds crazy but it is what it is. So with that said, let the image above represent a planet.

The planet represents the company that you want to go into.

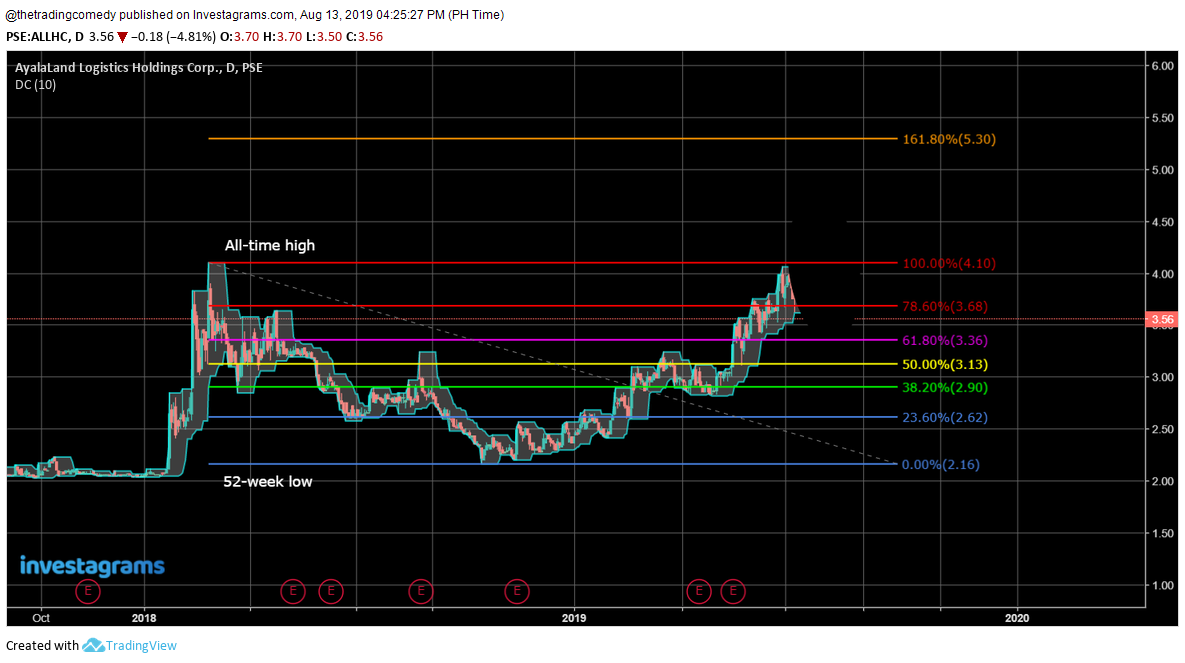
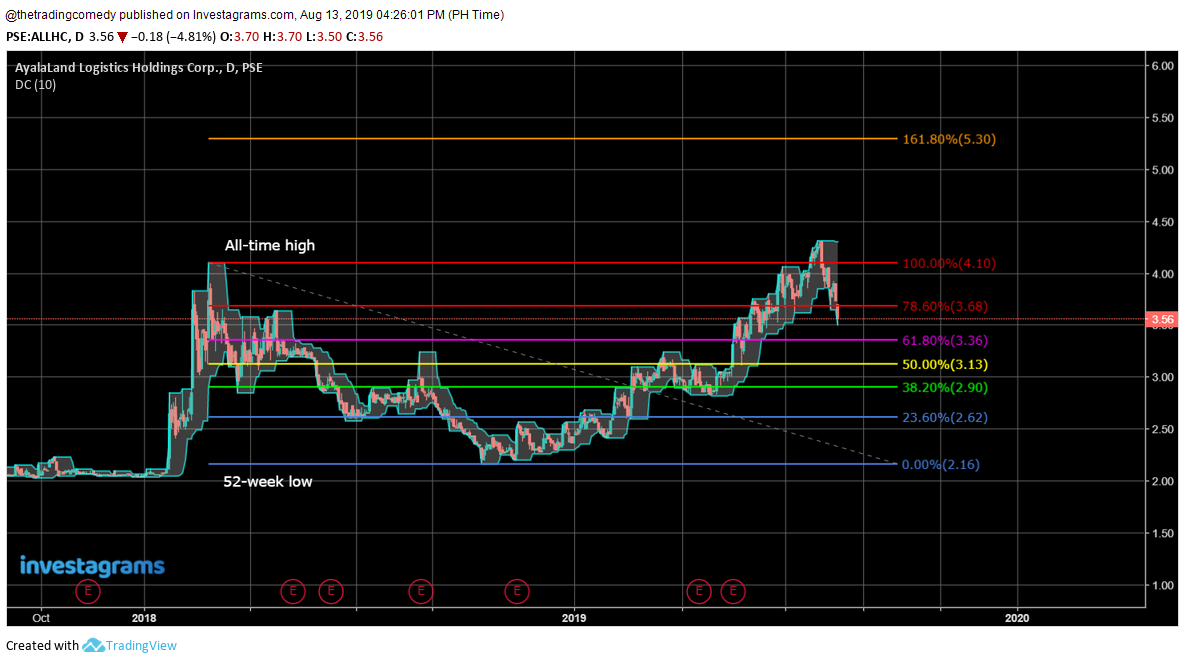
A planet has history and it can be divided into these levels:

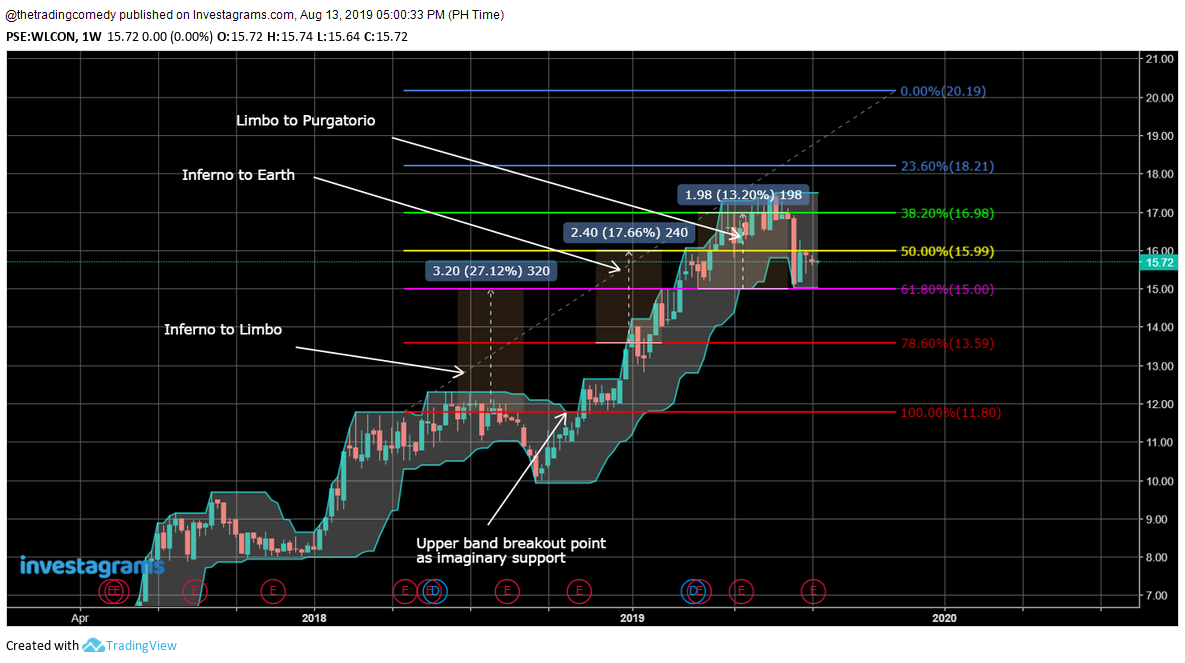
Inferno and Limbo can be interpreted as the planet’s bad history.

Purgatorio and Paradiso can be interpreted as the planet’s good history.

So wait, you mean to tell me that the stock market is somewhat a form of literature?

You can put it that way if you want.

Doesn’t it sound entertaining when you think about it? The feeling of entering a planet, exploring it’s past, seeing if there is a possible future for the planet to grow?

Let me give you another perspective: Say you are a general and you have an army at your disposal.

You want your army to explore a planet so what do you do?You send them out on a mission.

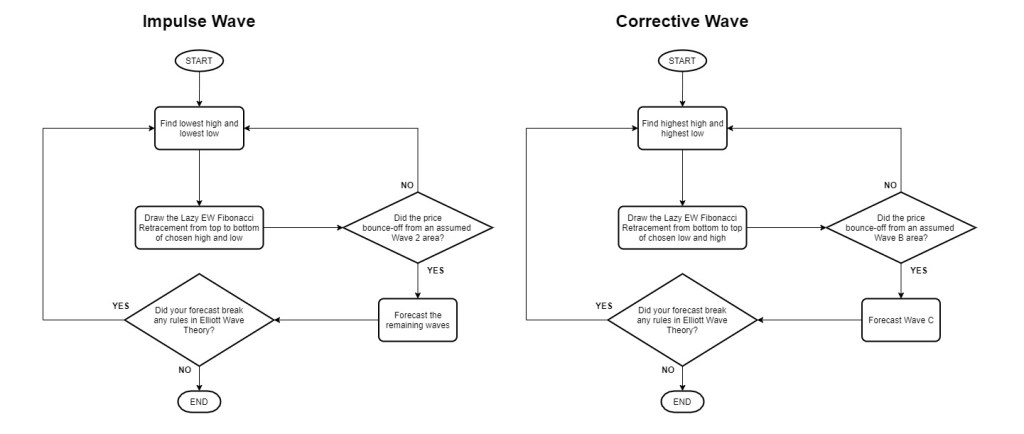
But wait! You don’t just send them out there, you need a map!

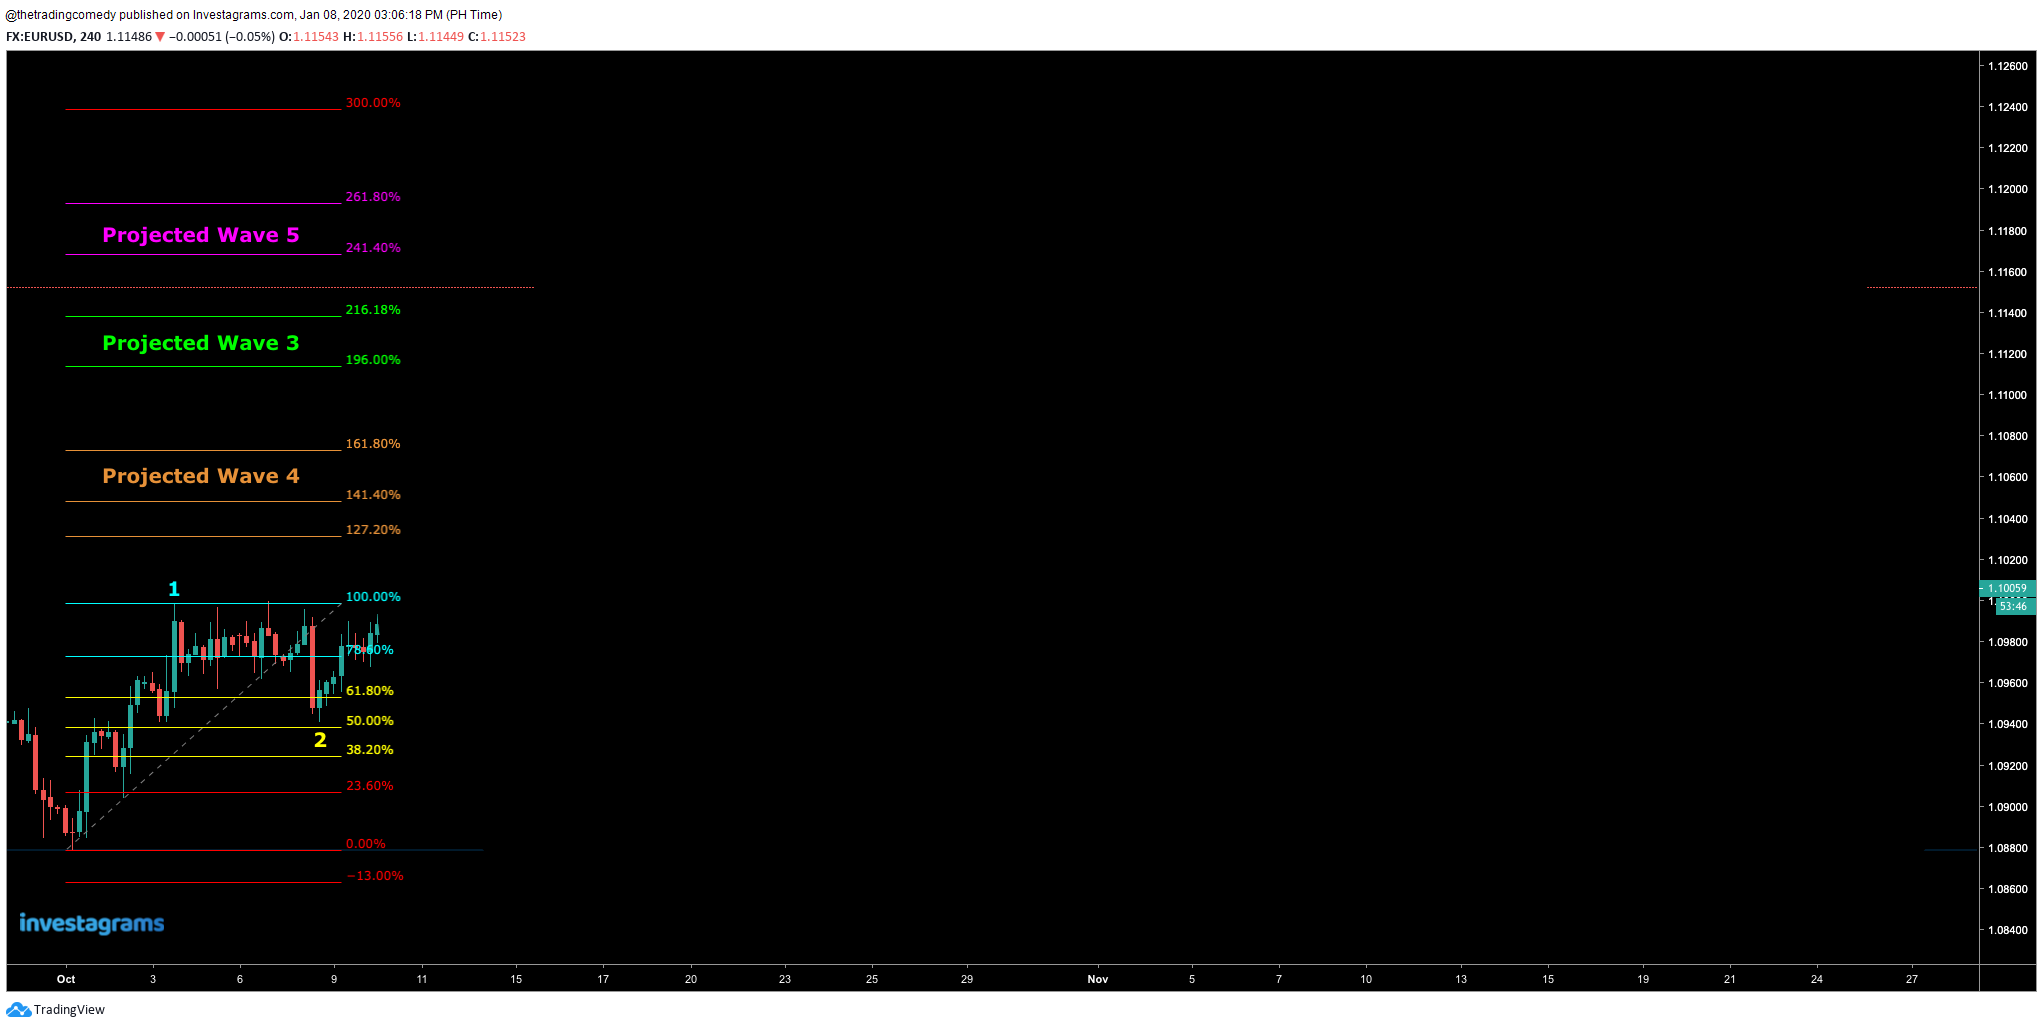
But how do you create that map? There are a lot of ways, but I can give you one very simple way:

Planet $JFC mission plan

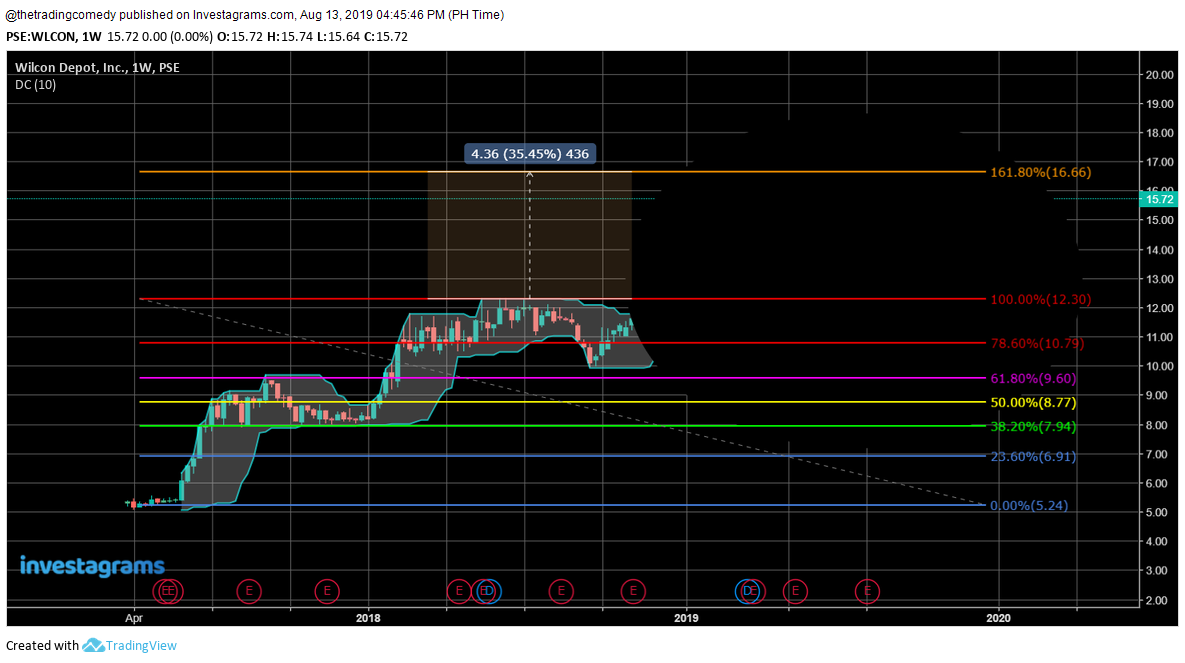
Whoa! How did you determine those plots?

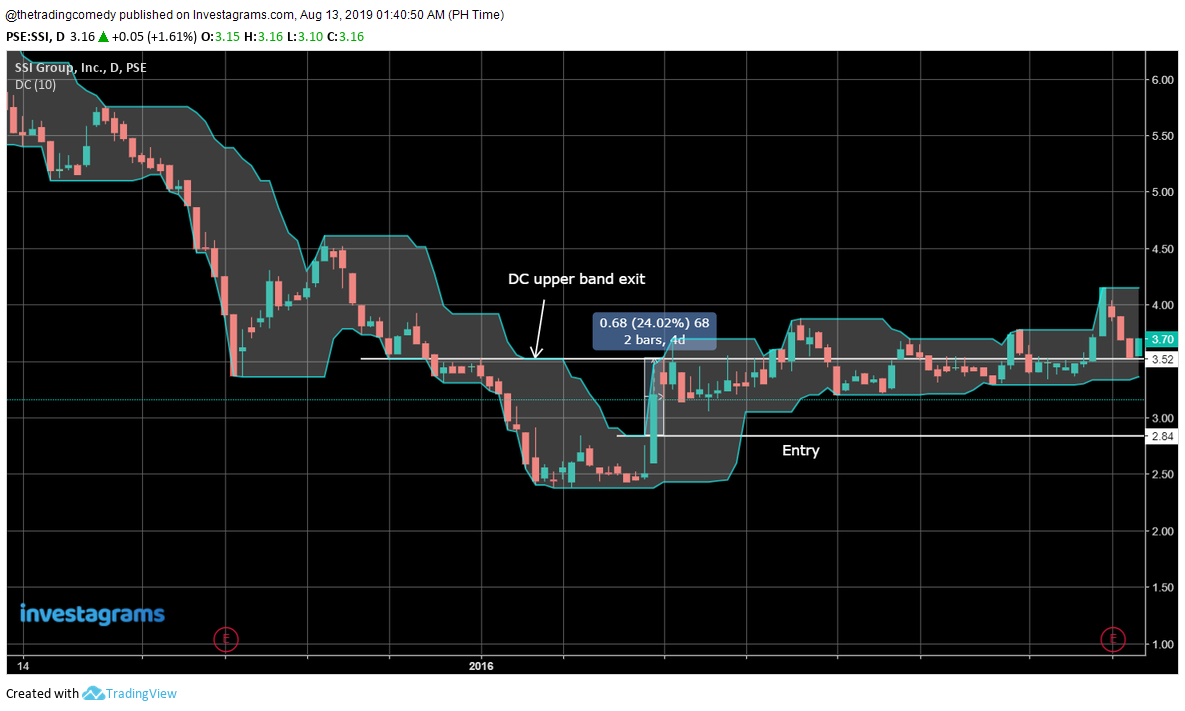
It’s just a matter of looking at the planet’s history. Will you look at that? Here’s what it looks like when you send 23,100 of your troops to planet $JFC.

Creating your plan can actually go as basic as this.

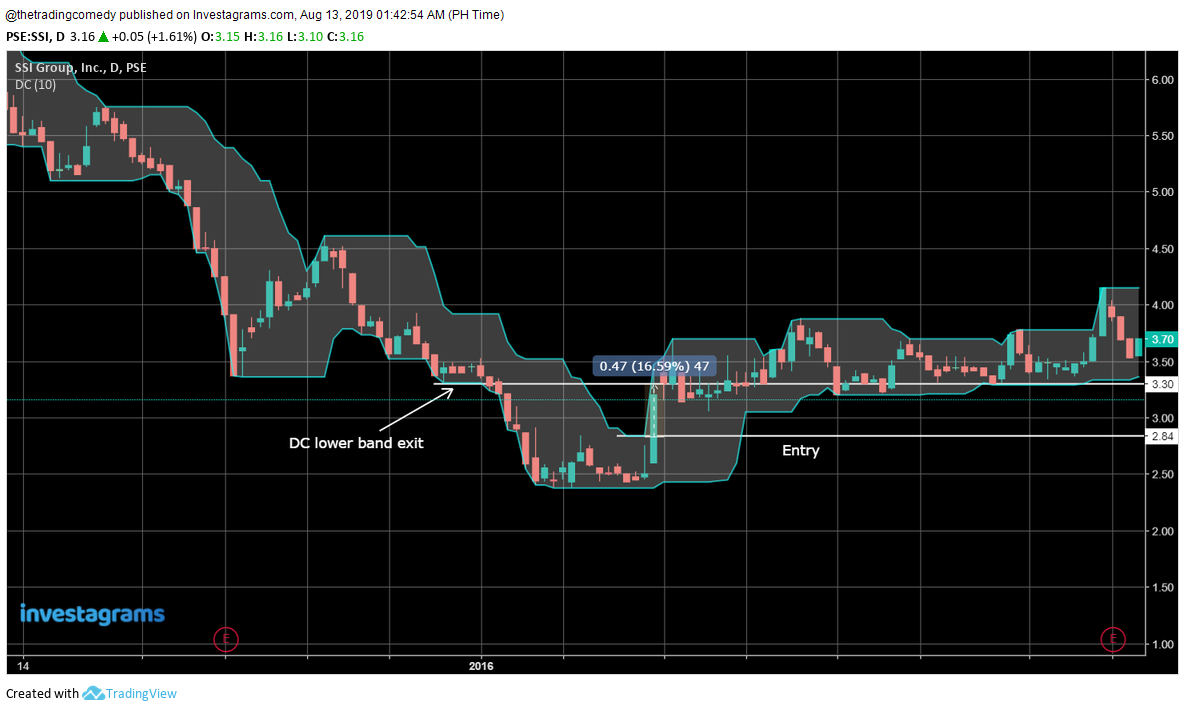
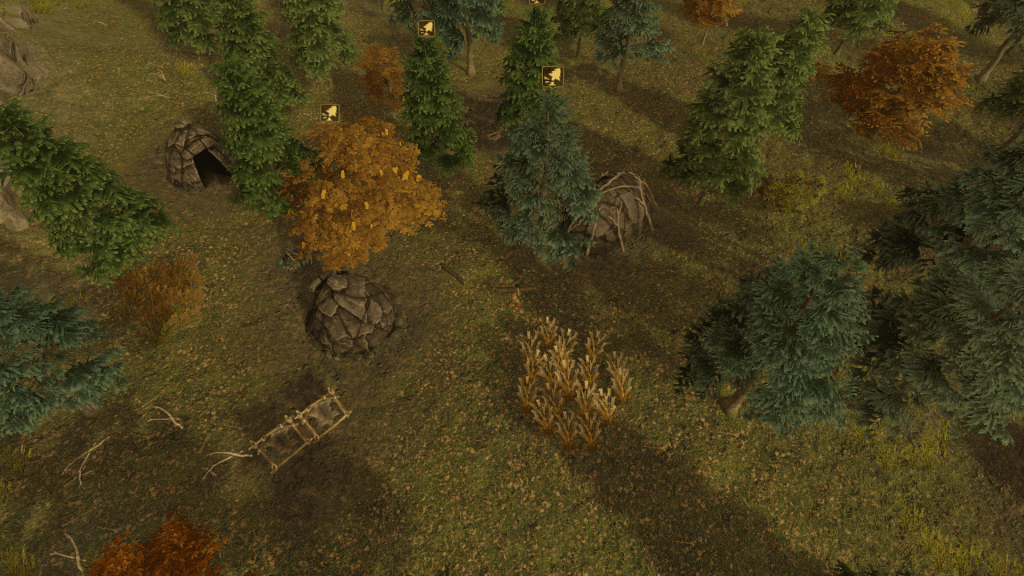
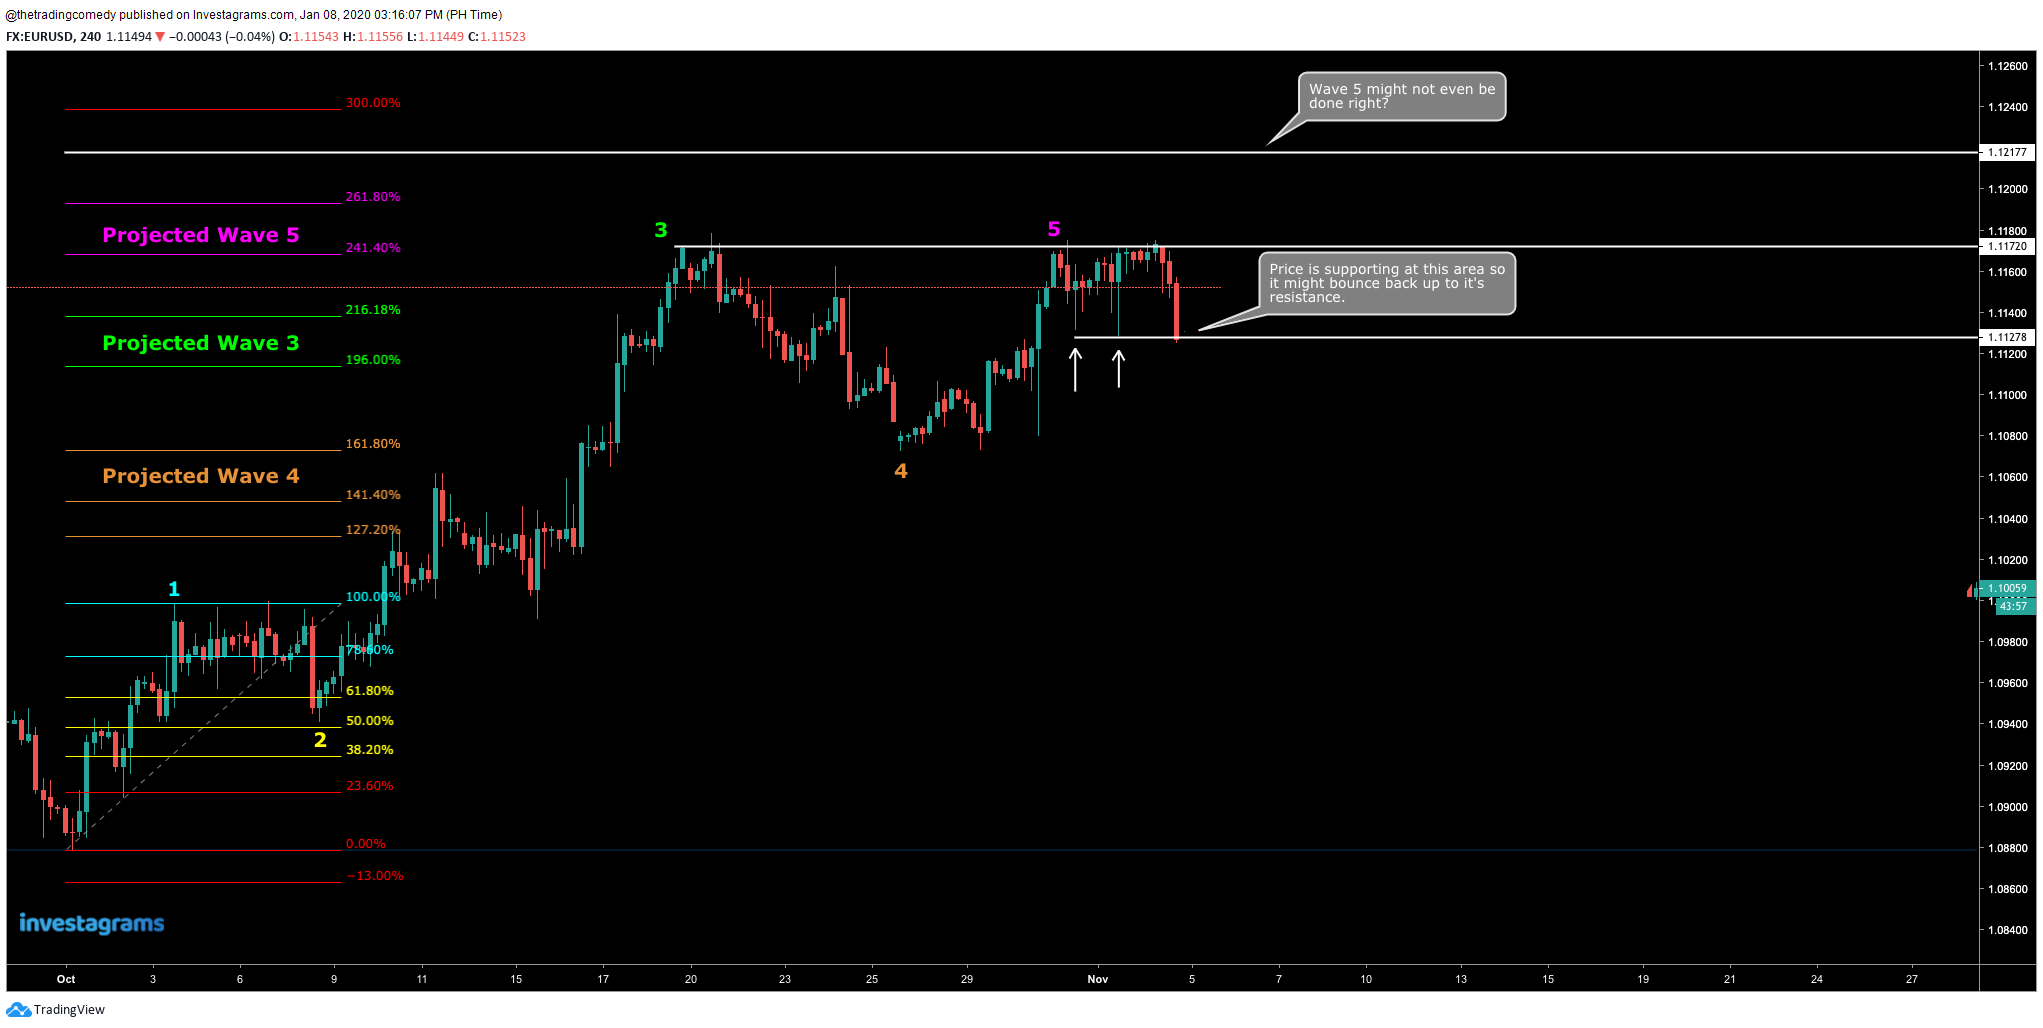
As a general, you should know how to minimize casualties. But what happens if you don’t plan? Maybe something like this:

$JFC with heavy casualties

Oh shit what happened back there? Why did that general lose 2,200 of his men?

Because he didn’t follow the map. The map was perfectly planned and yet he lost. Why you may ask? The general became emotionally invested in his men.

He forgot that the war that he was getting into involves risk. Because of this fear of losing more men, he decided to withdraw his troops.

Damn that’s gotta hurt so what does the general usually do when he suffers that many casualties?

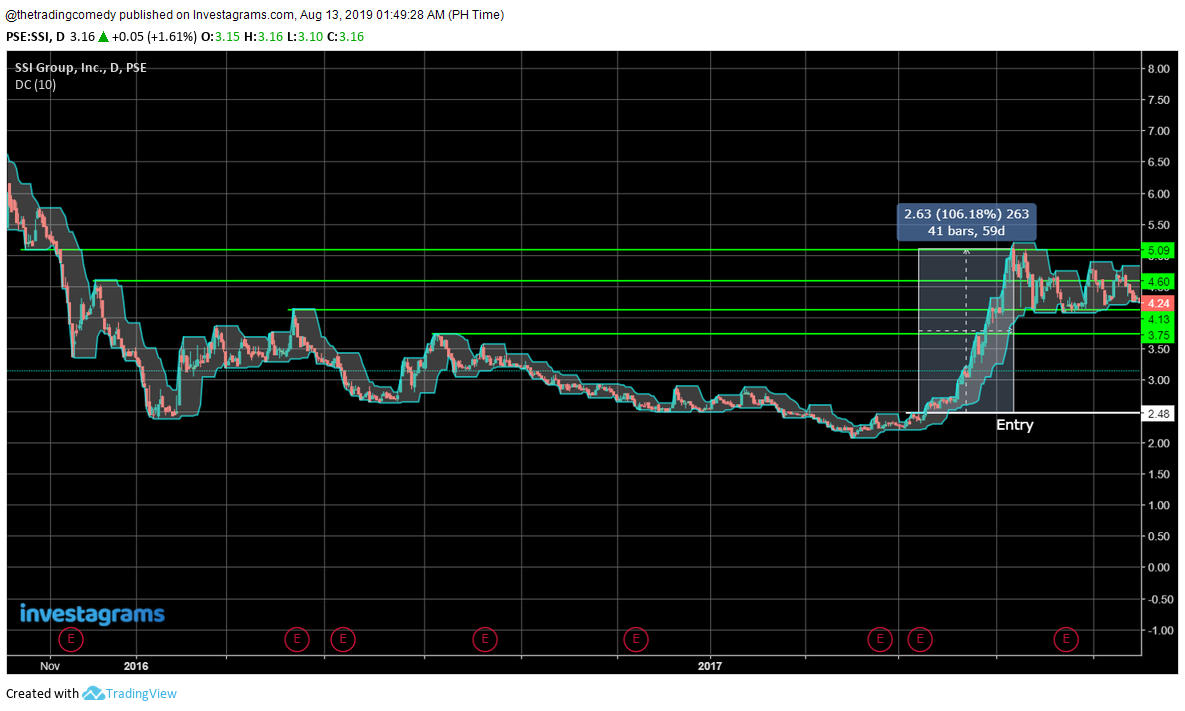
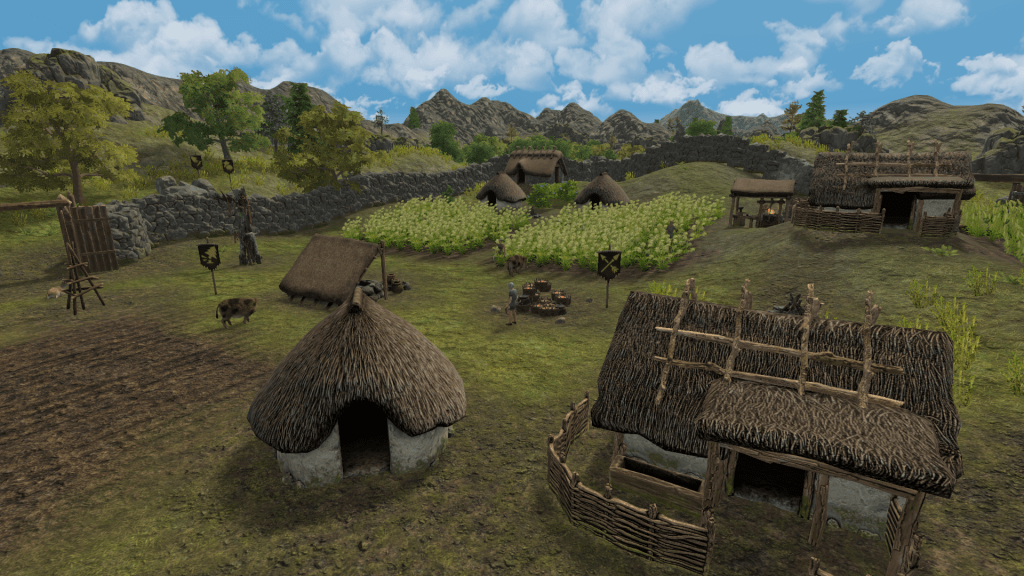
He takes a step back and watch the planet from afar. He goes back to the war room, plans his next actions, then waits for the perfect time to enter the mission again.

Planet $JFC Plan B

And now he waits…

Of course he’s not gonna enter the same number of troops.
That’s his way of protecting his people.

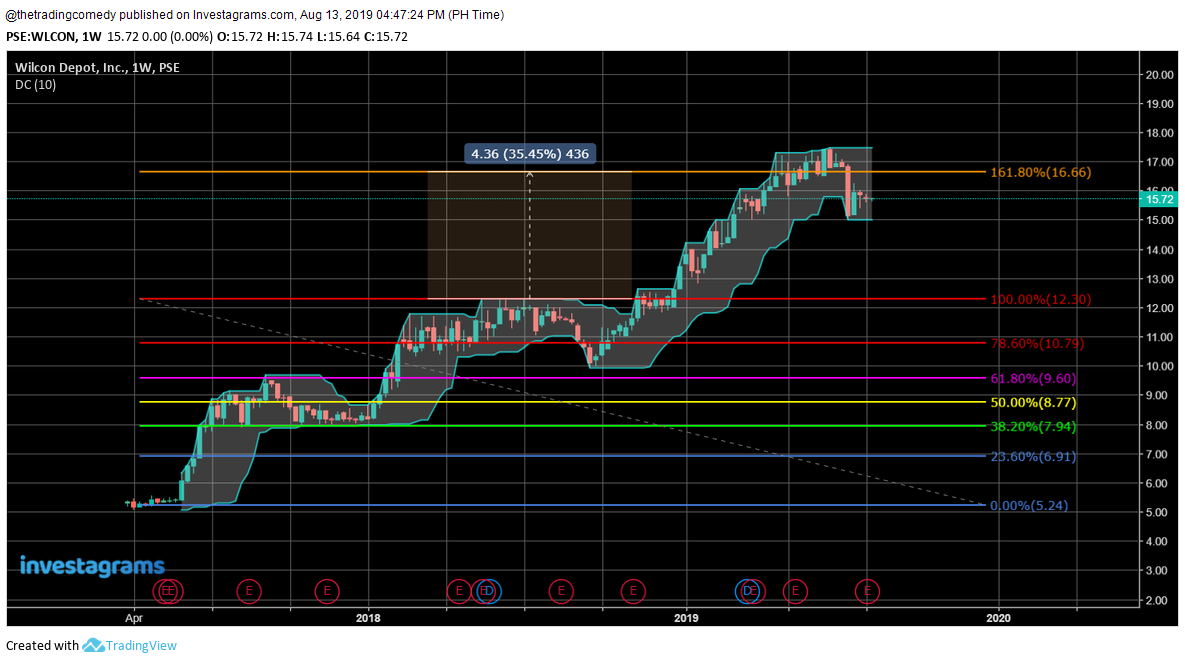
Let’s see the results:

Scenario One: The army leaves the planet after 5 months along with the people they rescued.

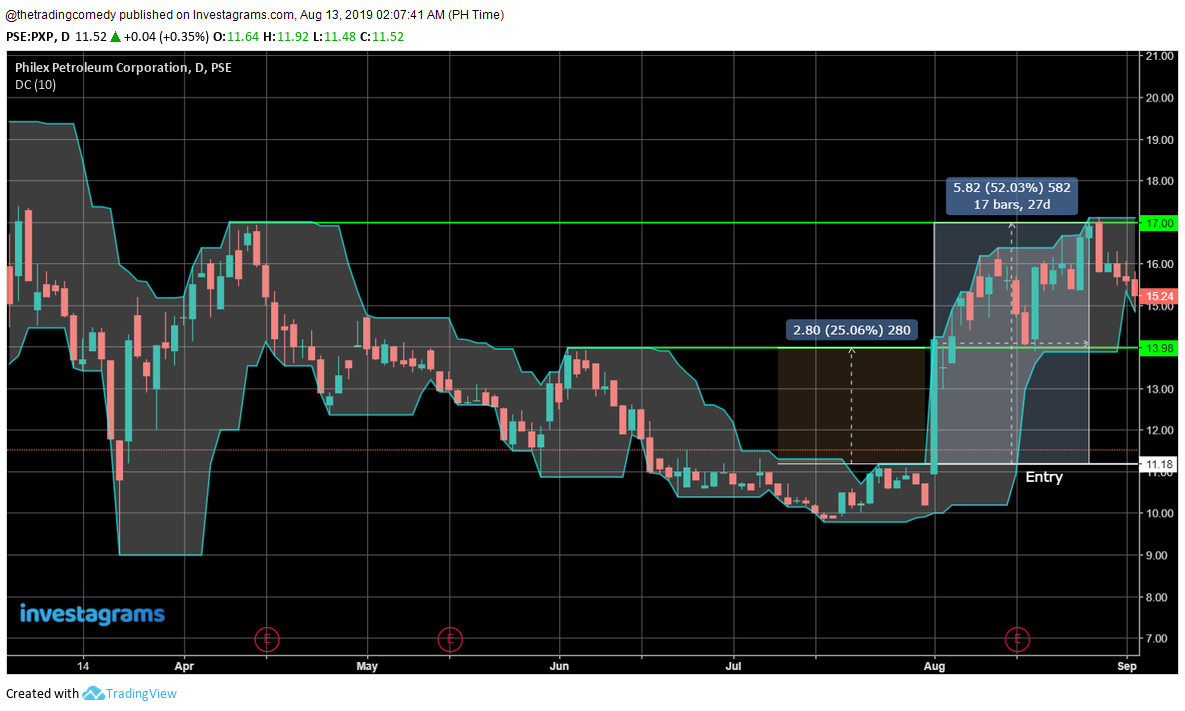
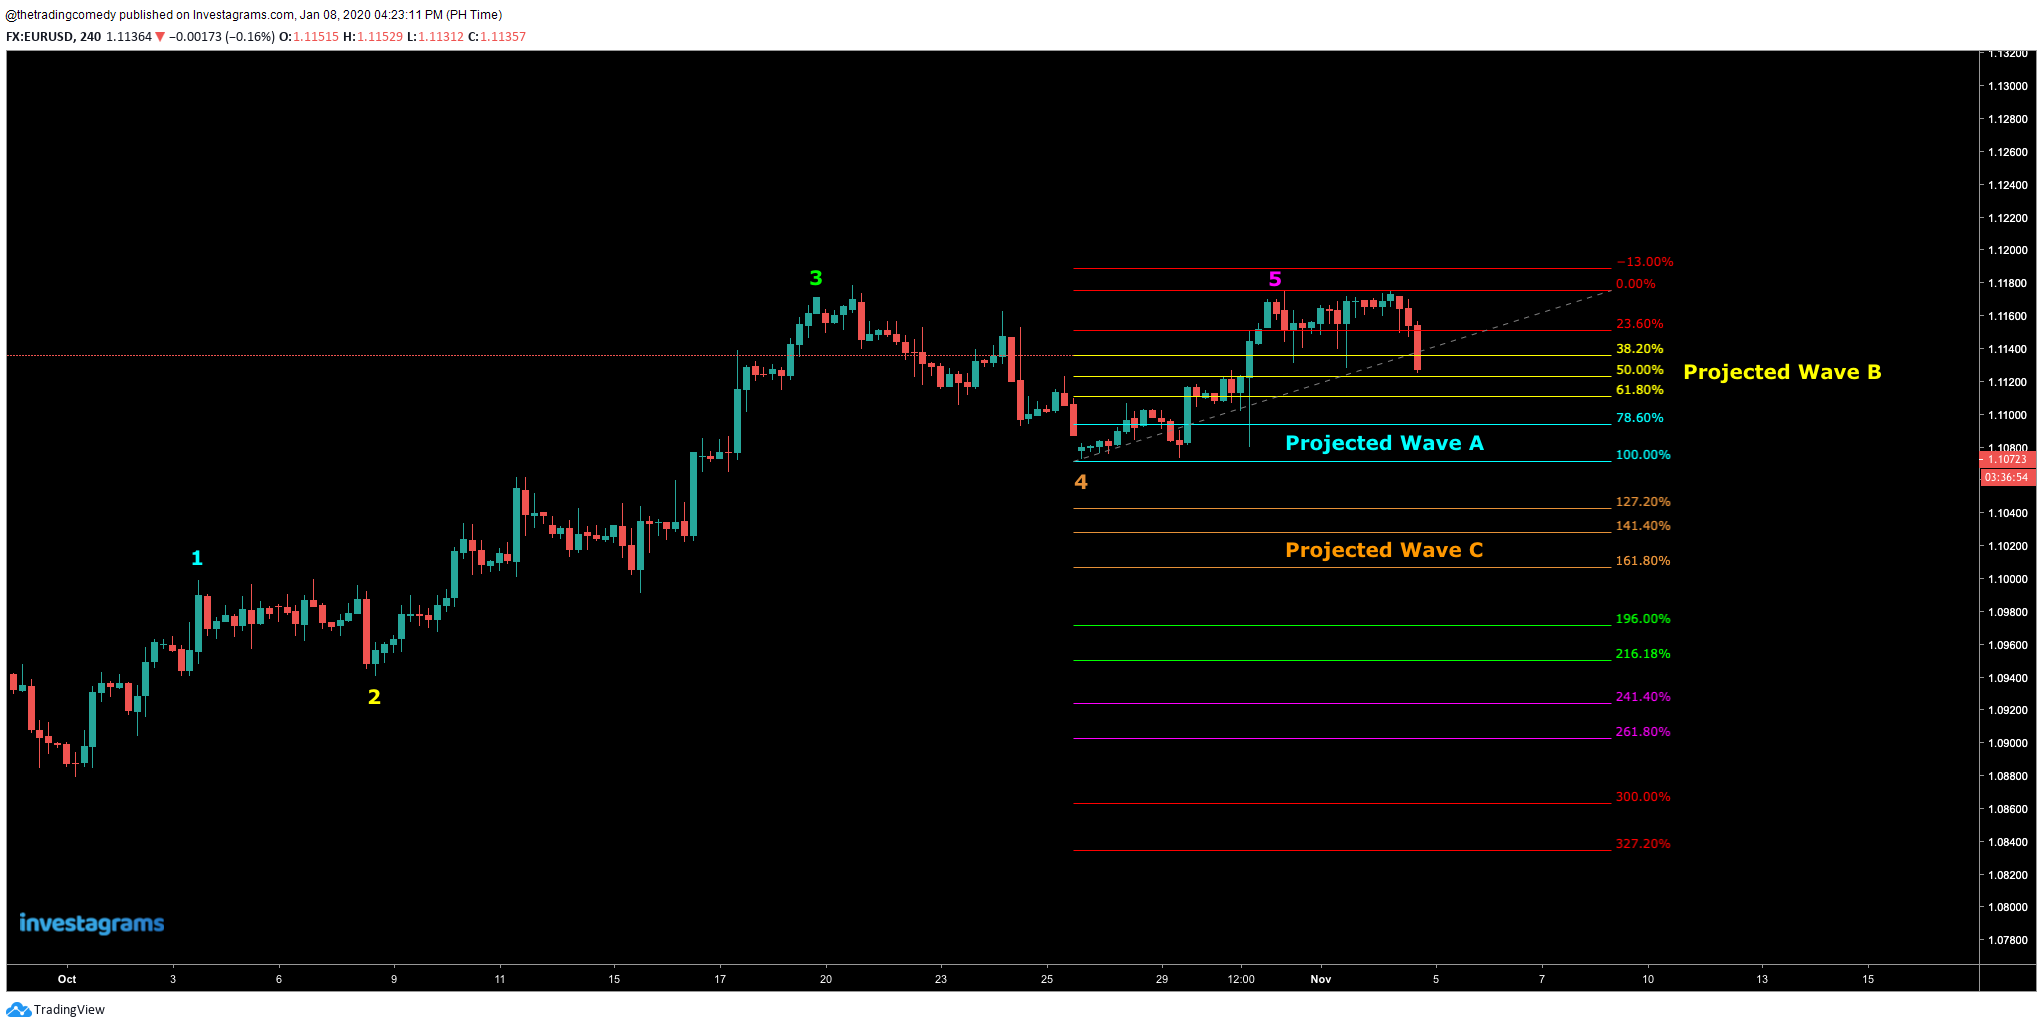
Another scenario would be this:

Scenario Two: The army leaves the planet after 8 months along with the people they rescued and never looked back.

So wait, whenever an army tries to enter a planet are you basically saying that they are fighting a war??

Well if you observed what happened in his journey at planet $JFC then yes, he just led his troops to a warzone. As you can see, you are not the only army exploring the planet hoping to rescue people or gather resources or whatever your objective is. You have other armies (traders/brokers) in the area probably after the same objective.

Wait a minute, I thought the stock market was kind of inspired by Dante Alighieri’s Divine Comedy where’s that part?

Patience reader, I just gave you one way of viewing the stock market: a strategic war game. Isn’t it surprising that you reached this part and you never got bored reading this blog? If you didn’t get bored at all, then let’s proceed.

Here’s the “Divine Comedy” part (well I kinda gave the reference away in the first part but anyway… 😂)

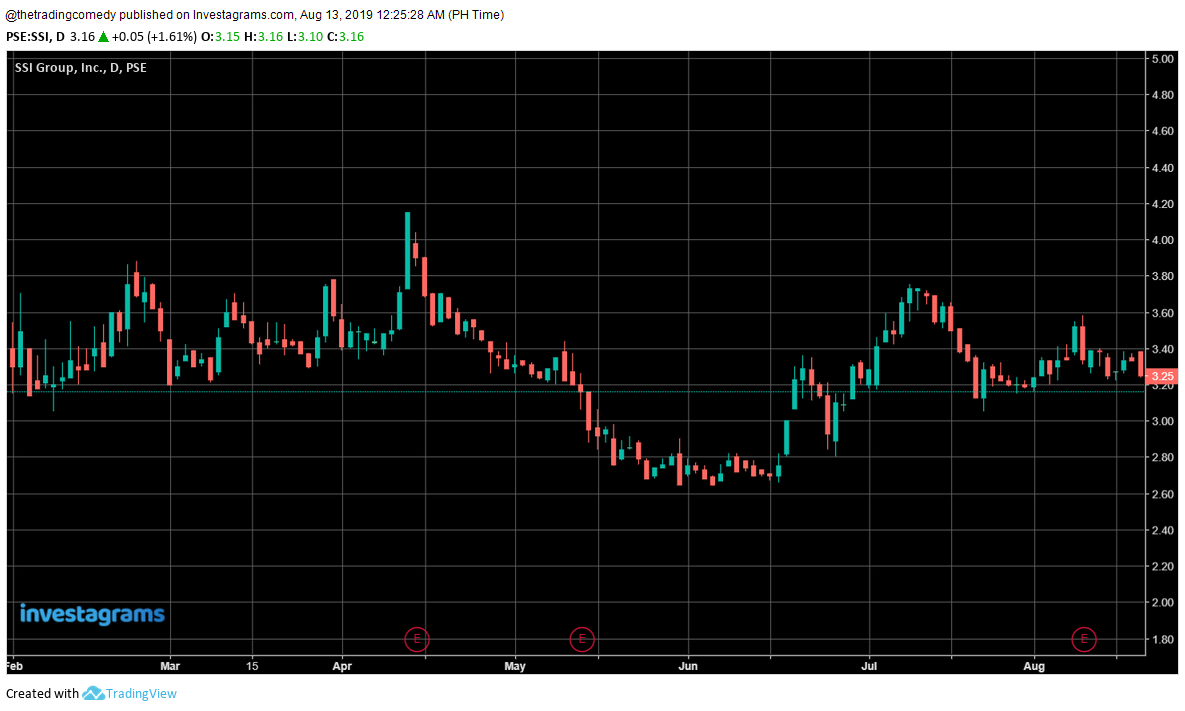
The stock market can also be like staring at a piece of artwork if you know how to have some sort of appreciation for it.

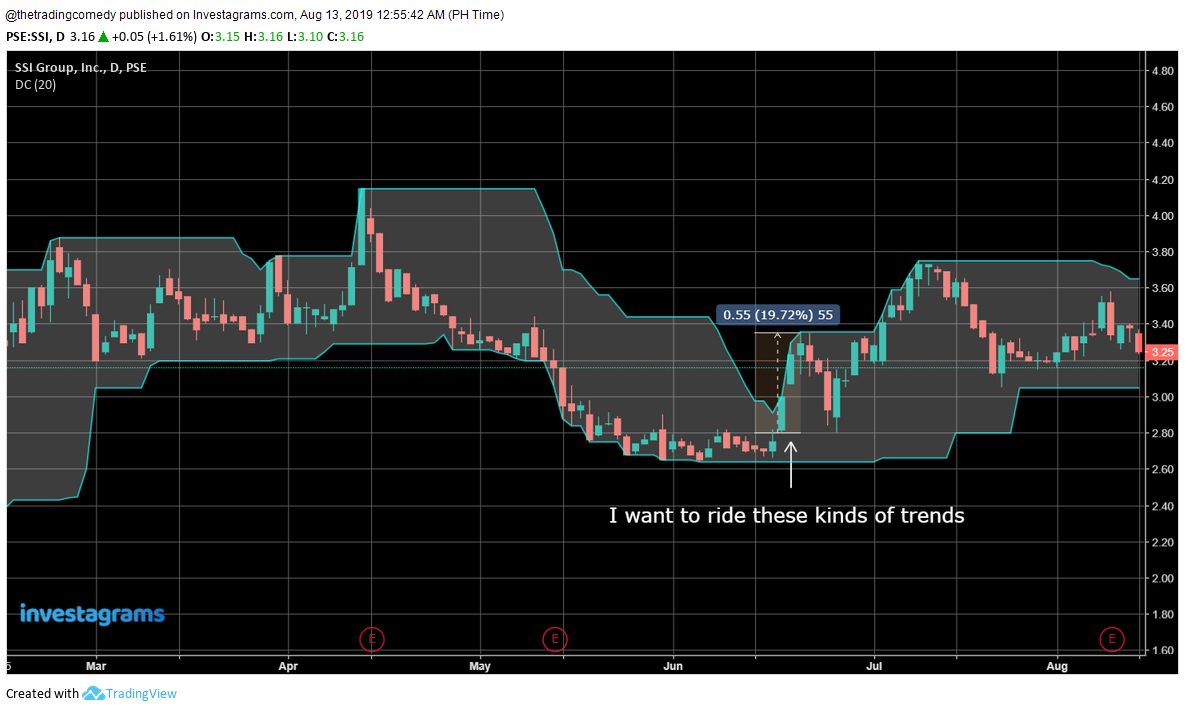
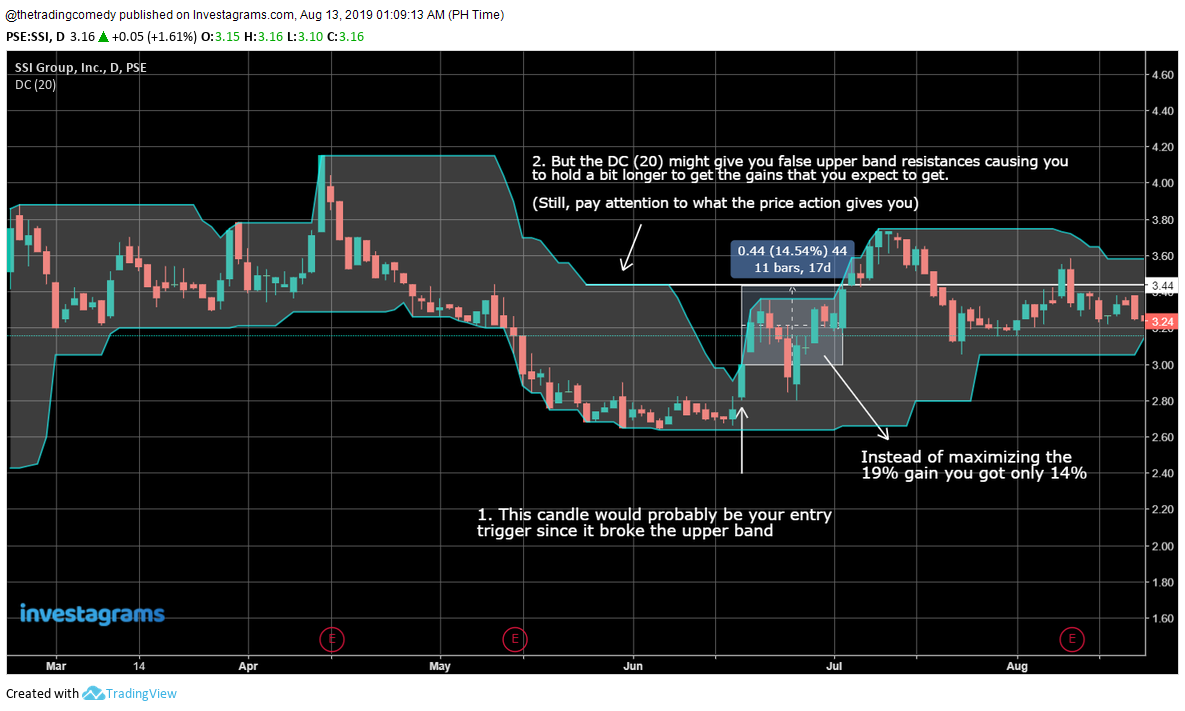
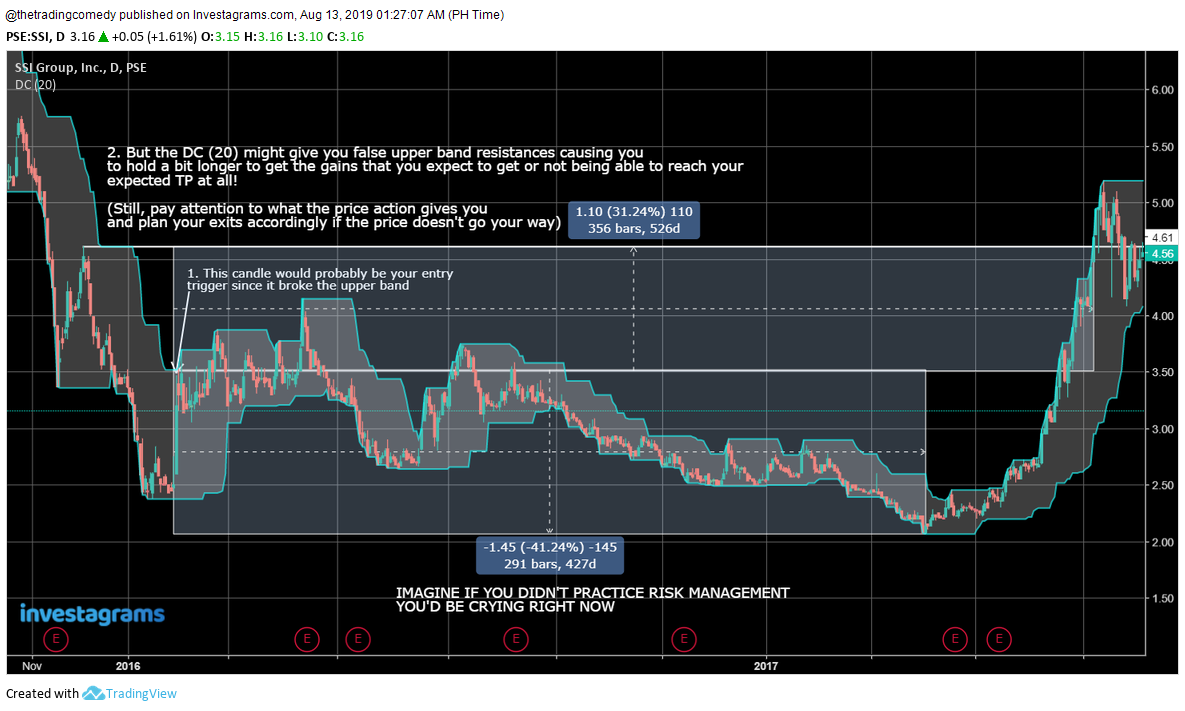
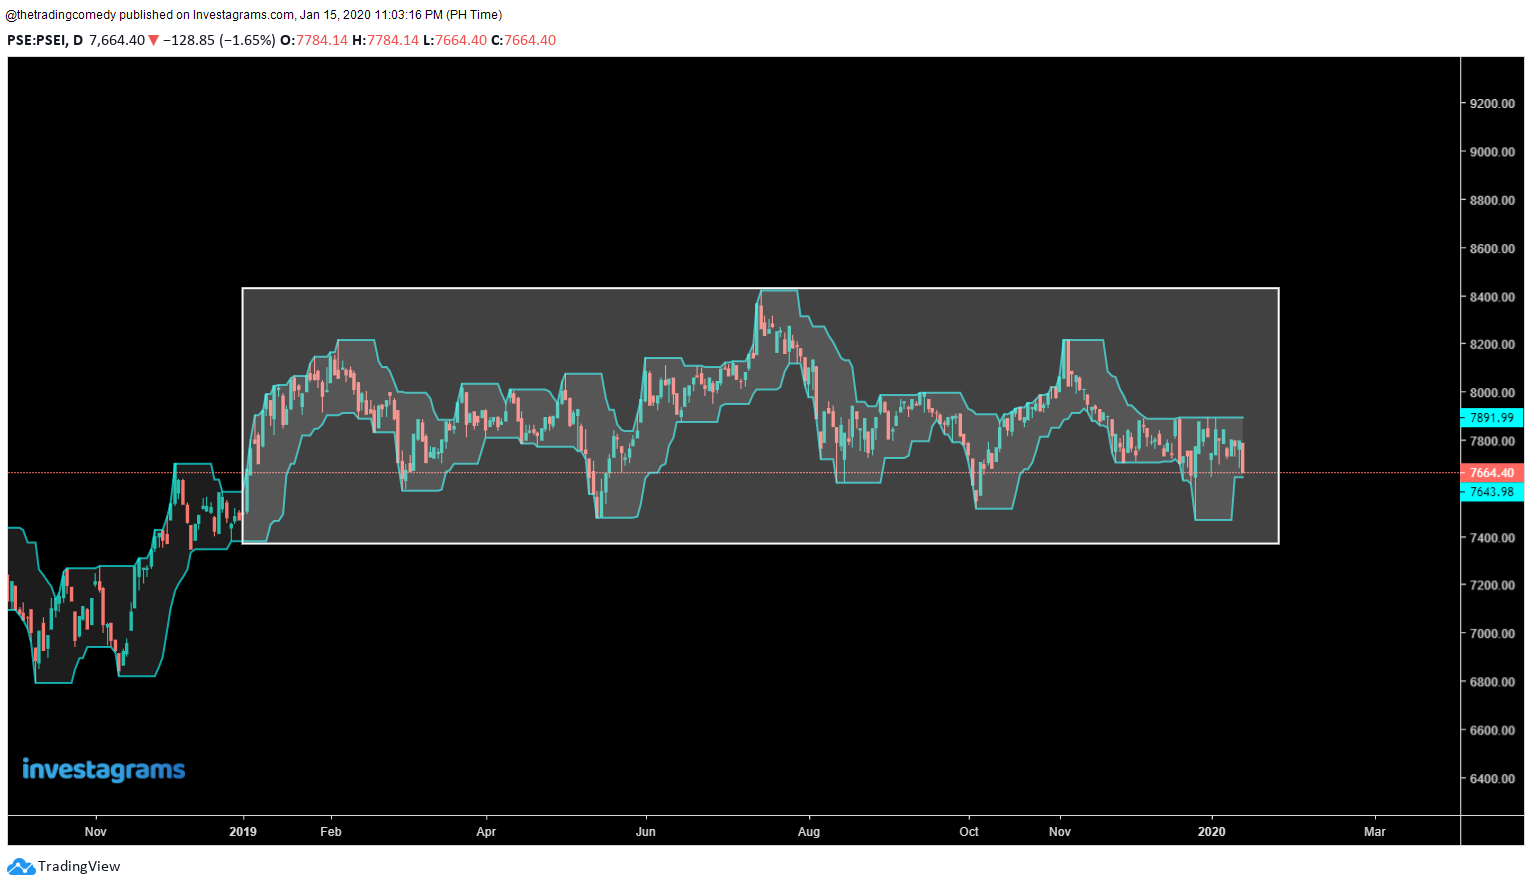
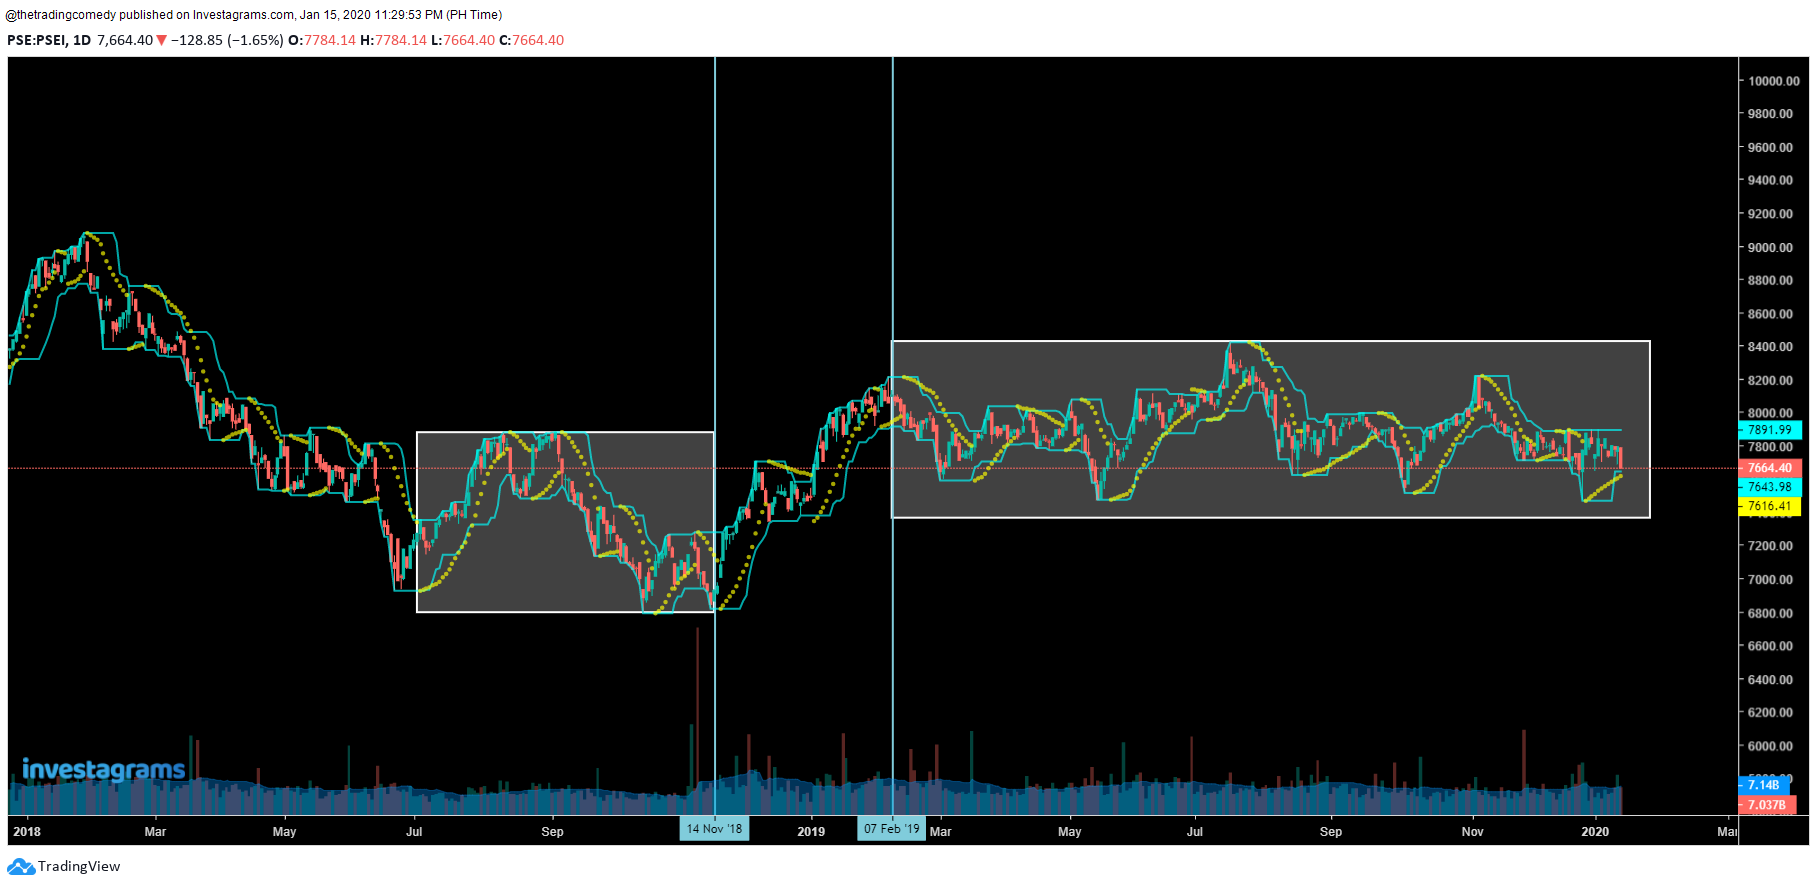
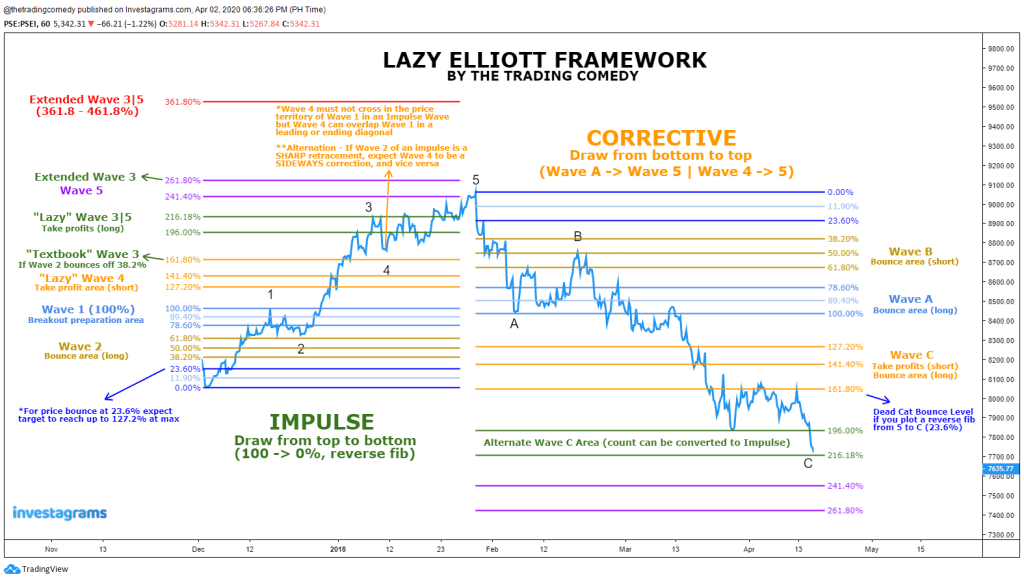
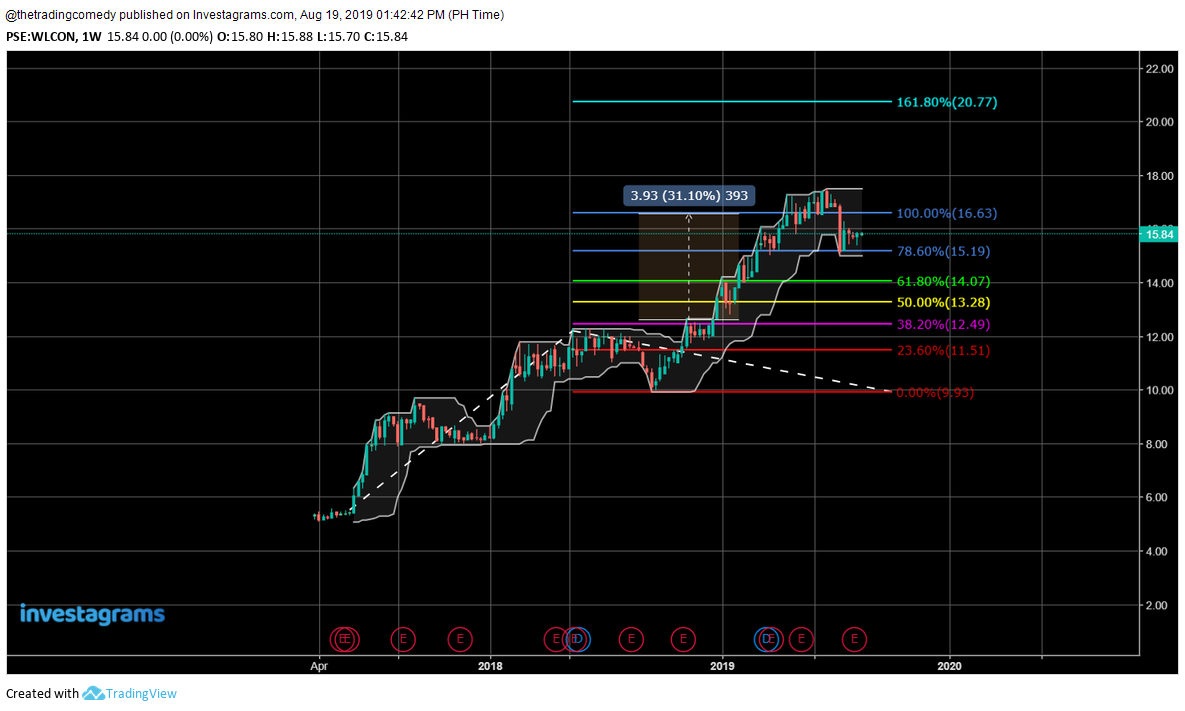
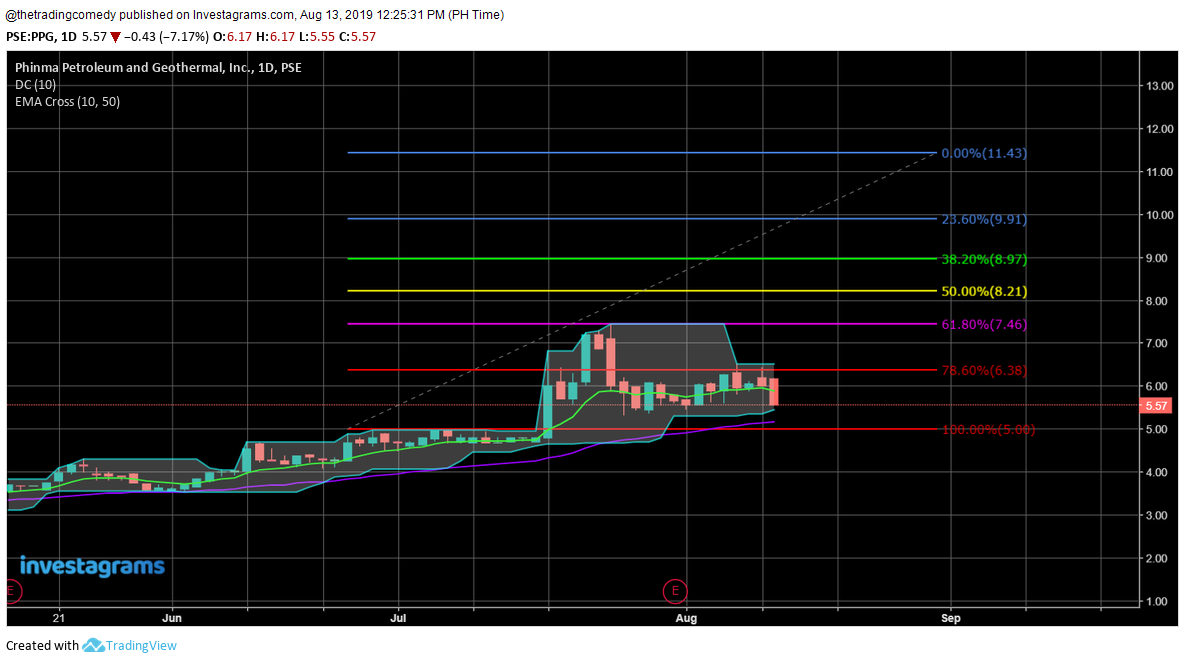
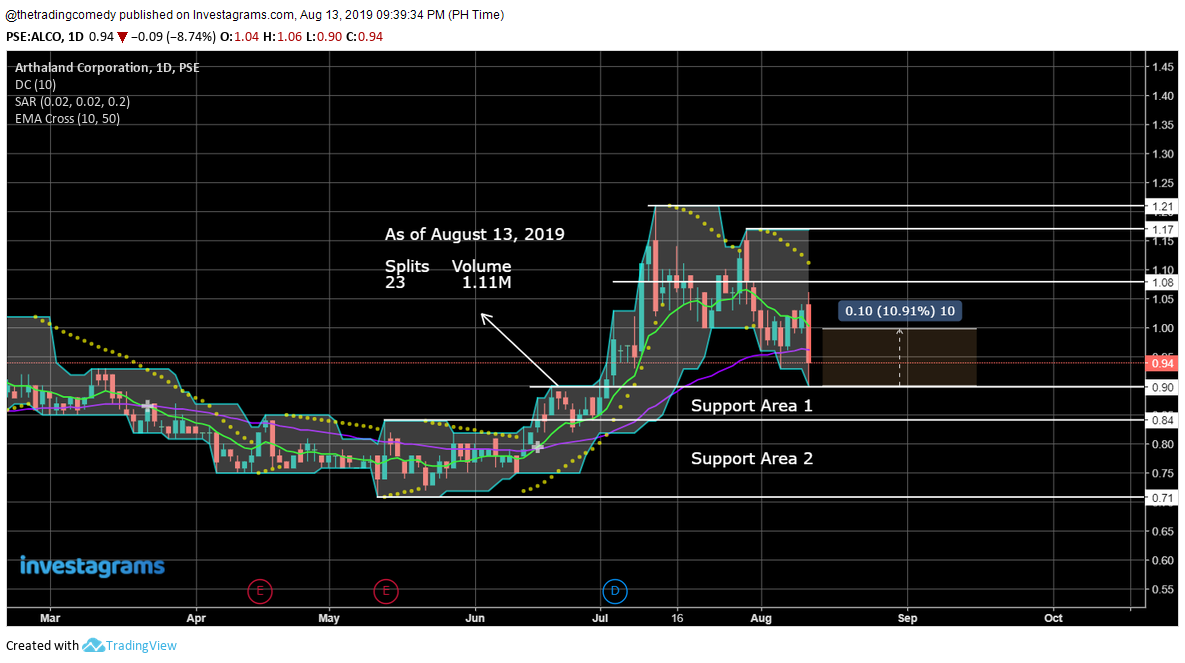
One way of looking at it is through risk management. And guess what? I have a video for that. But to give you an idea, it looks something like this:
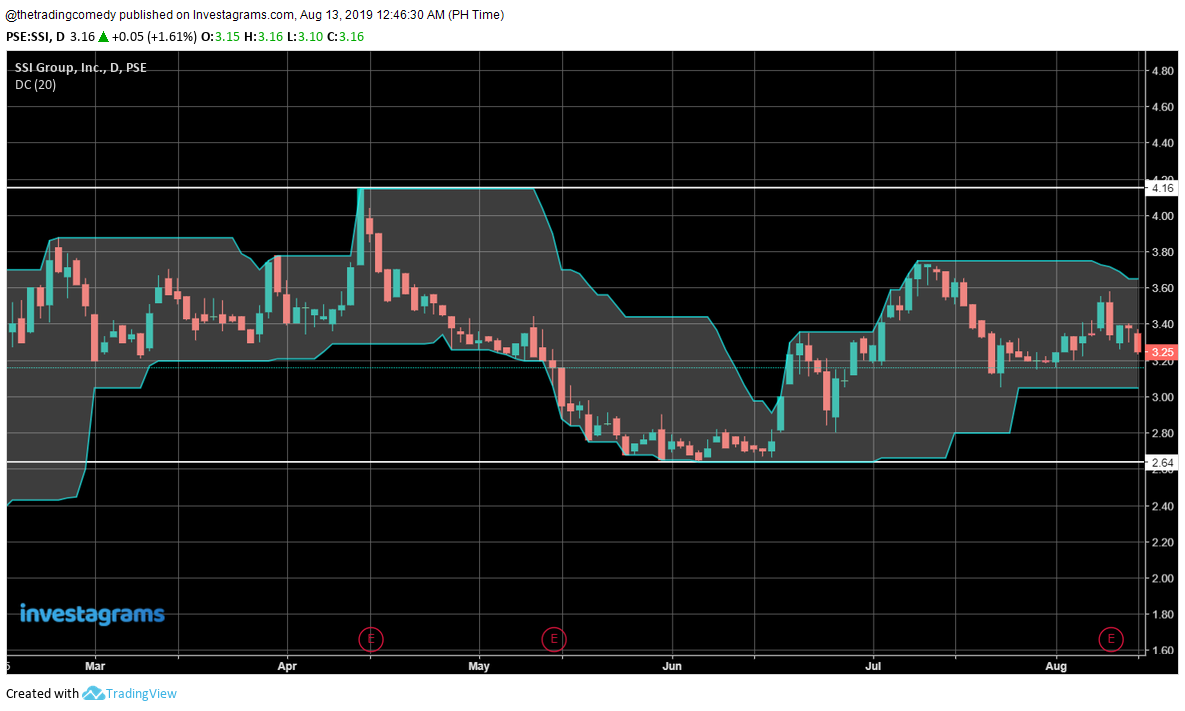
Planet $MBT Expedition Plan using the “Divine Comedy” approach

But wait…

Like this:

Planet $MBT Expedition Plan #2

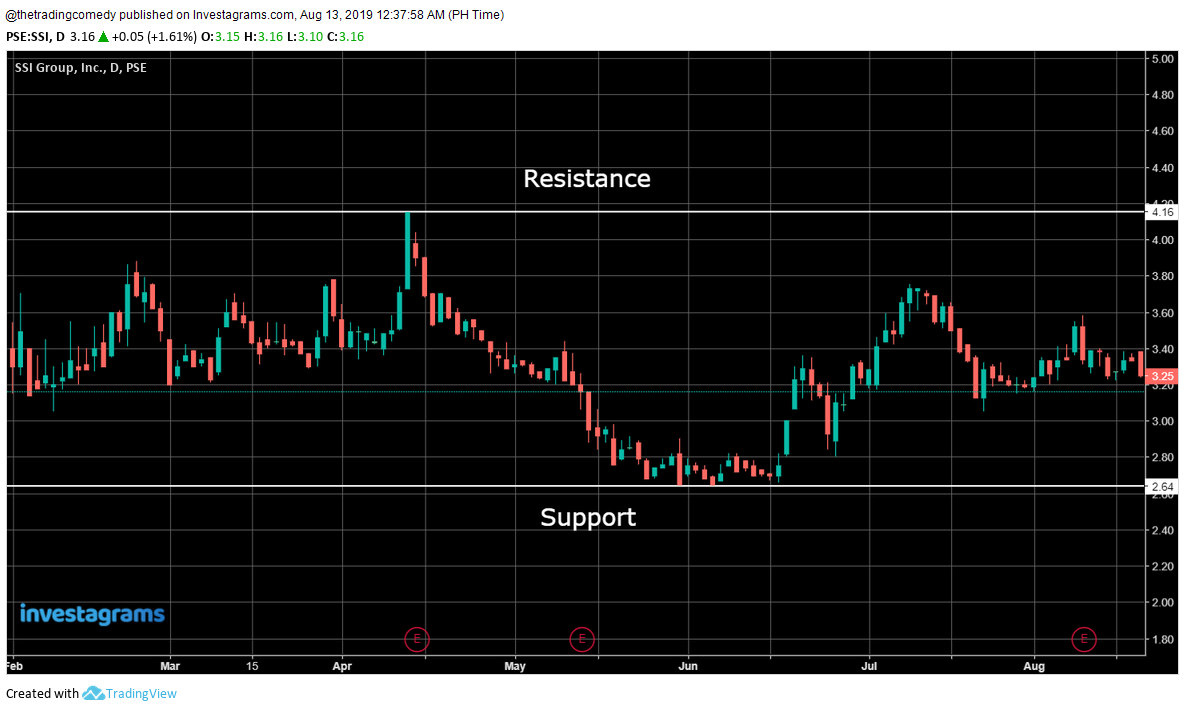
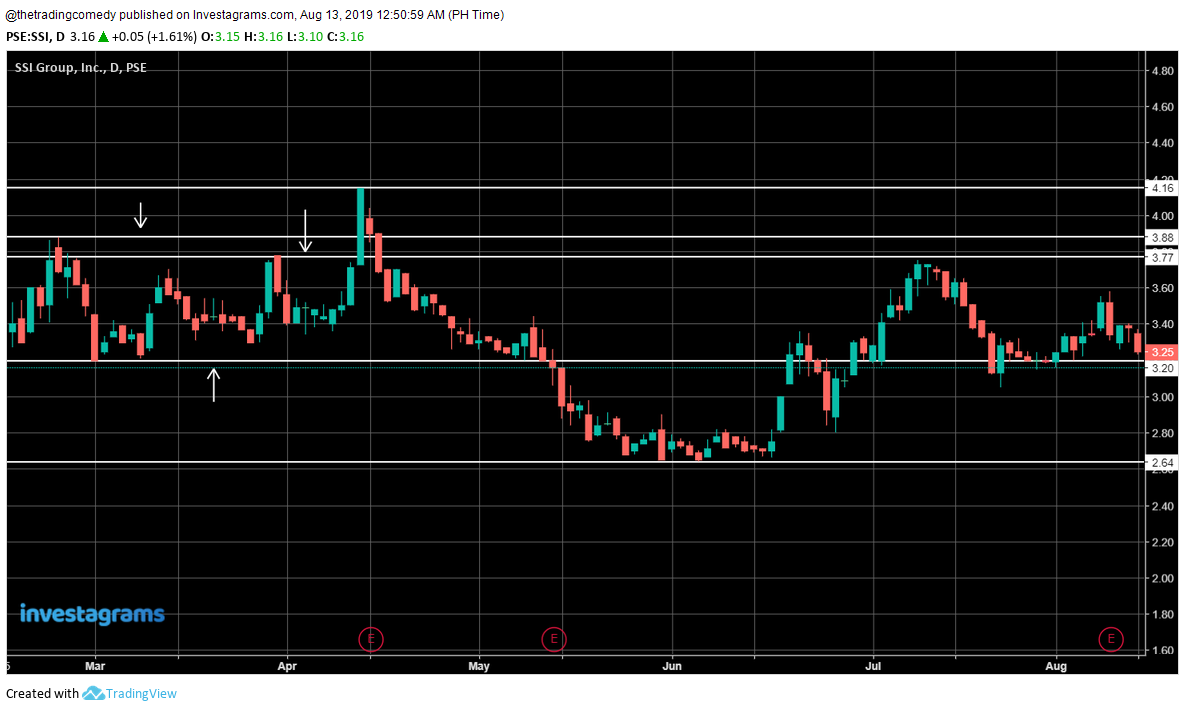
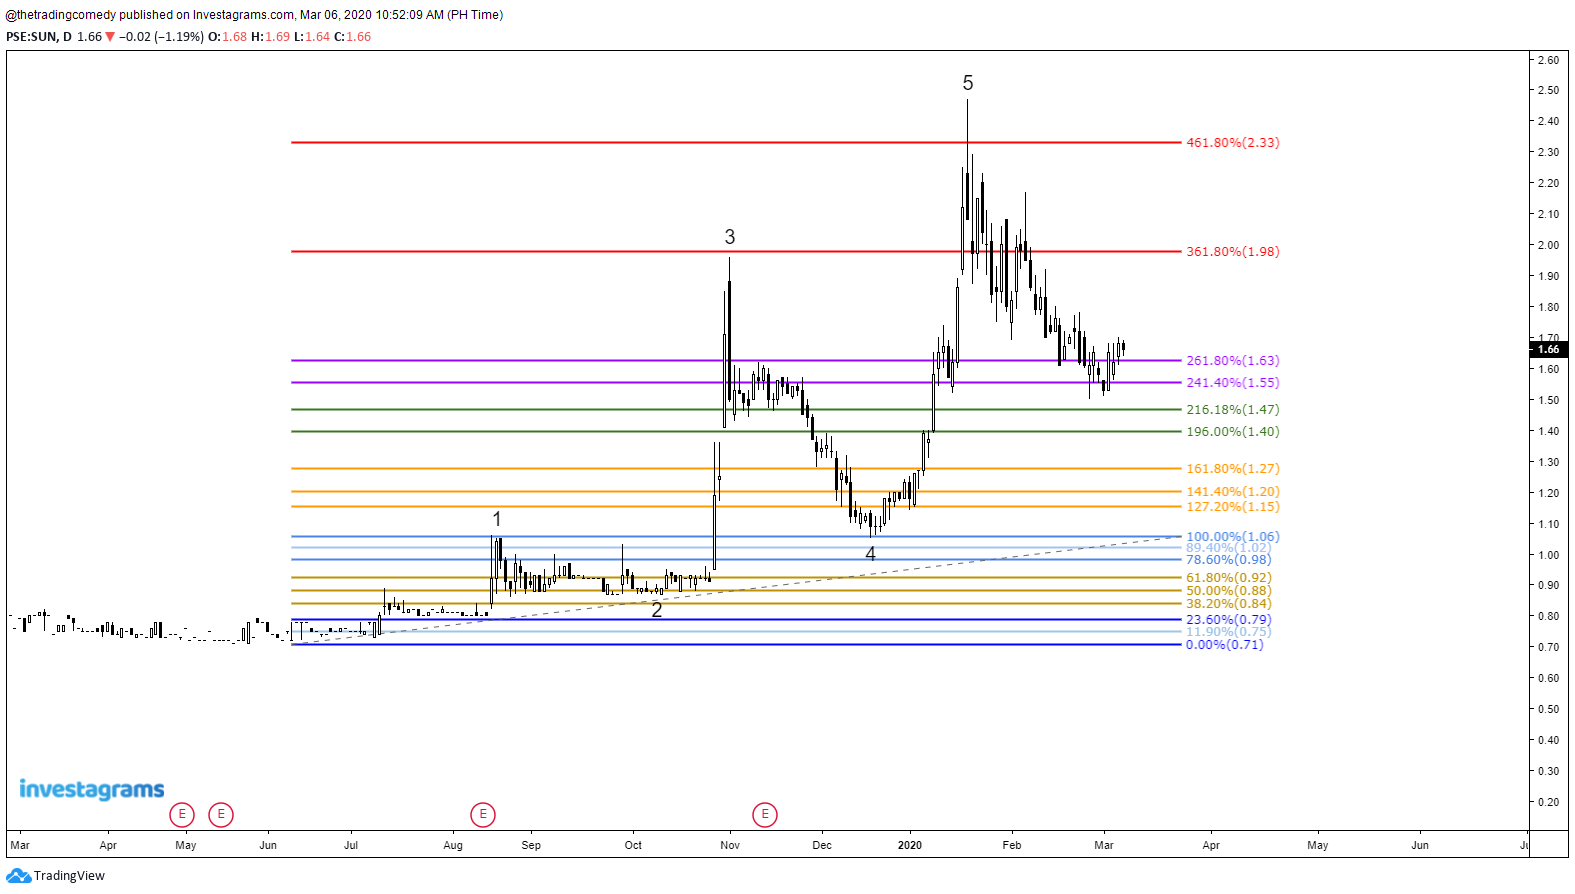
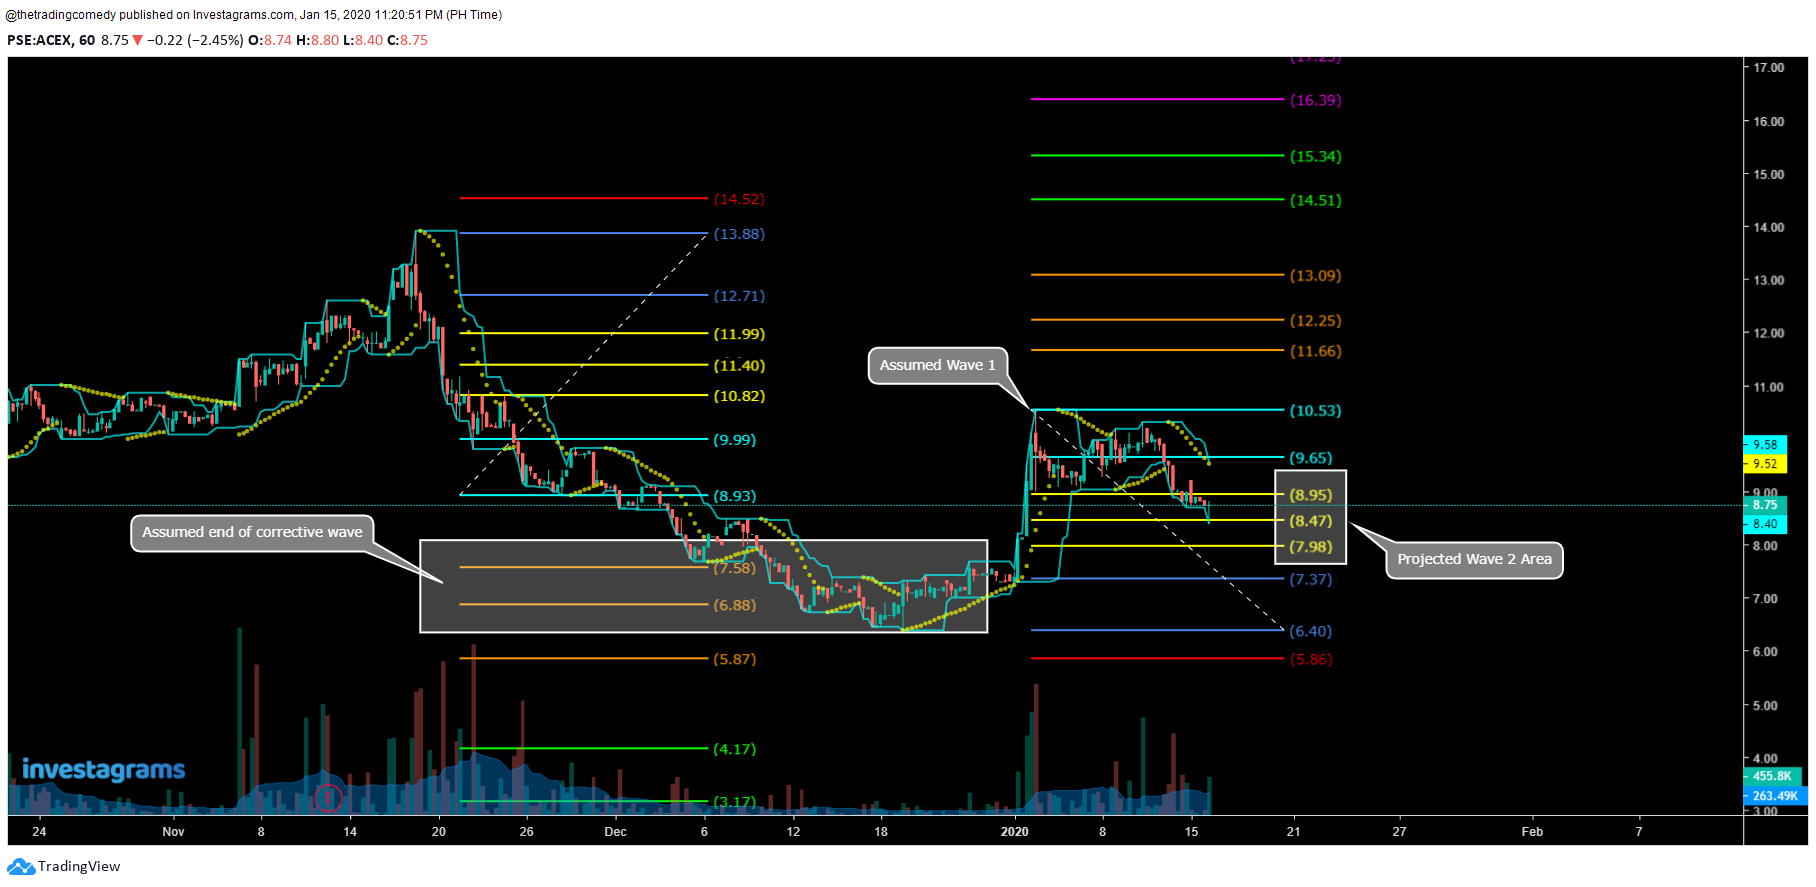
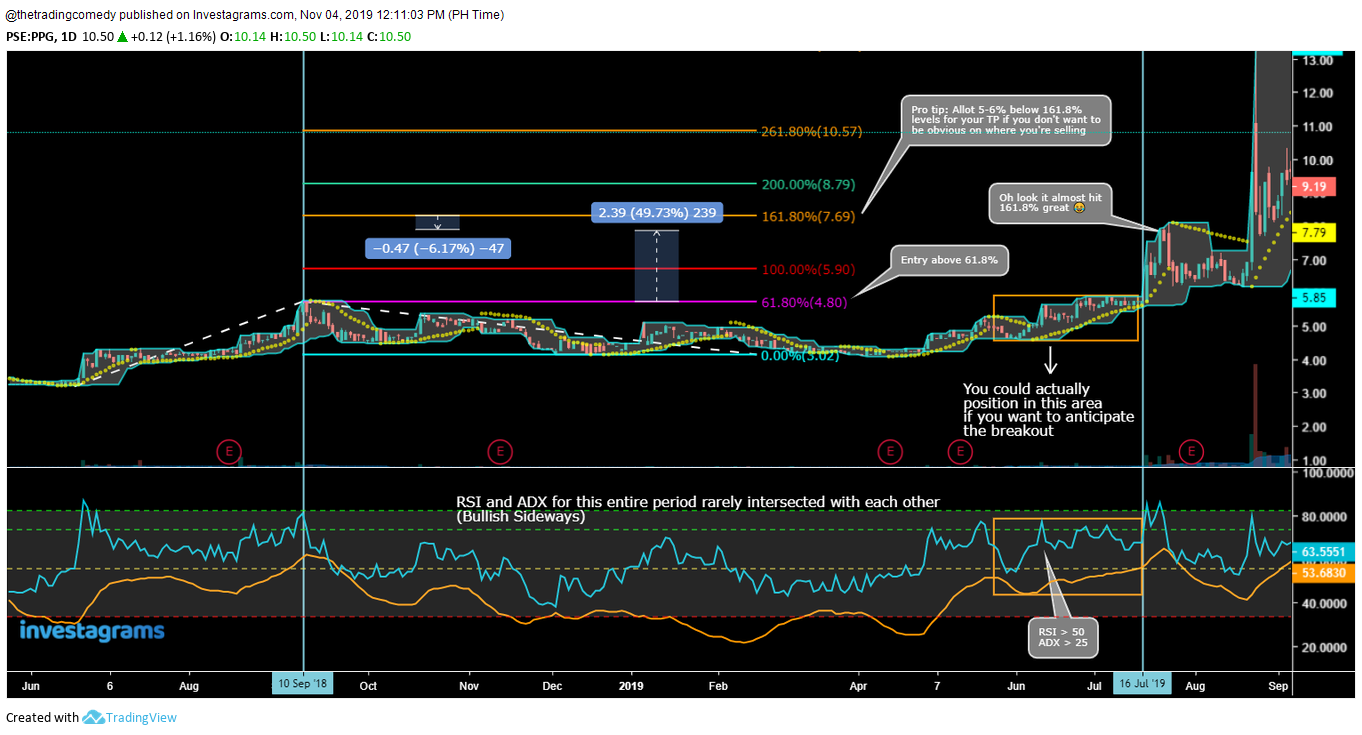
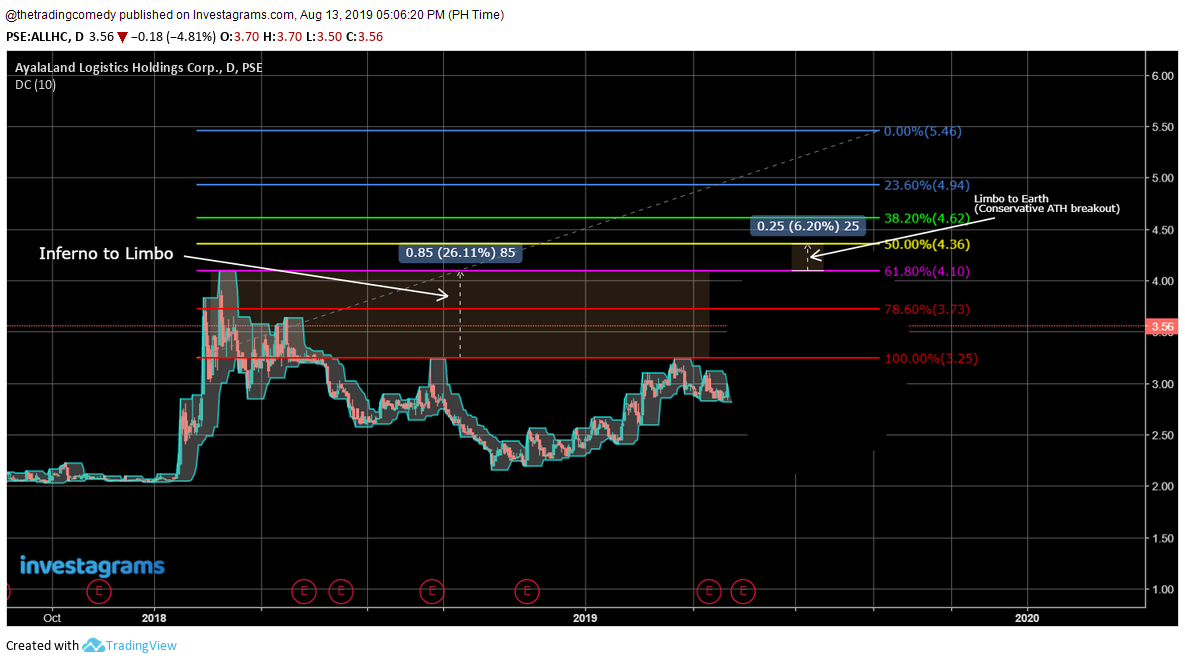
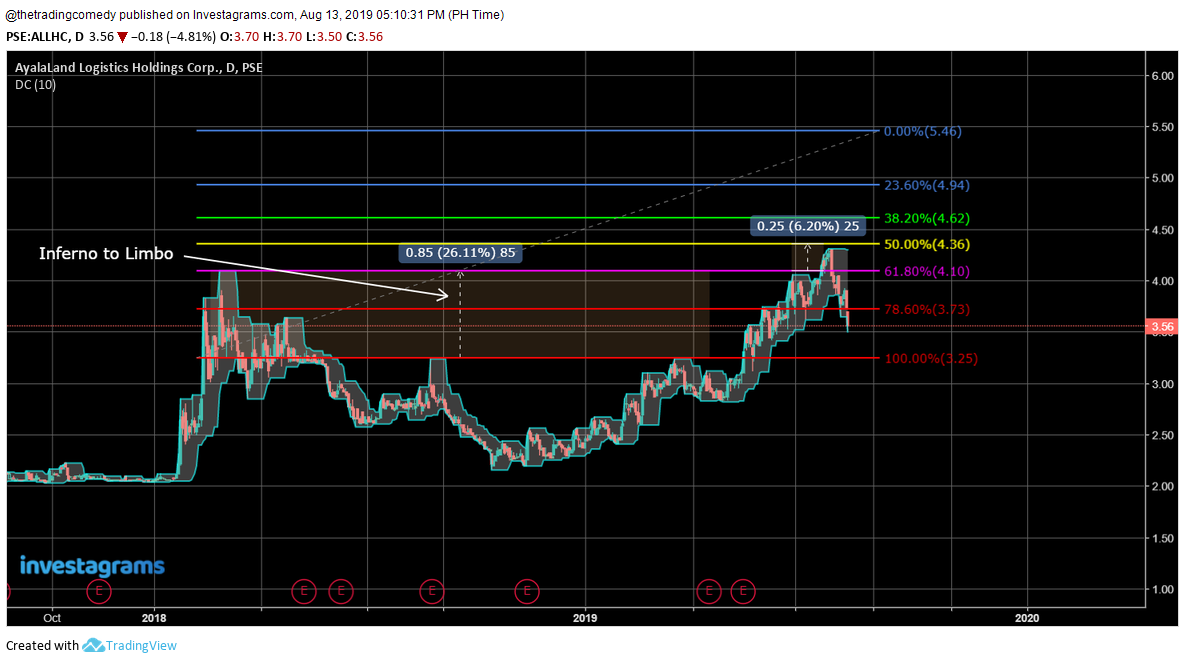
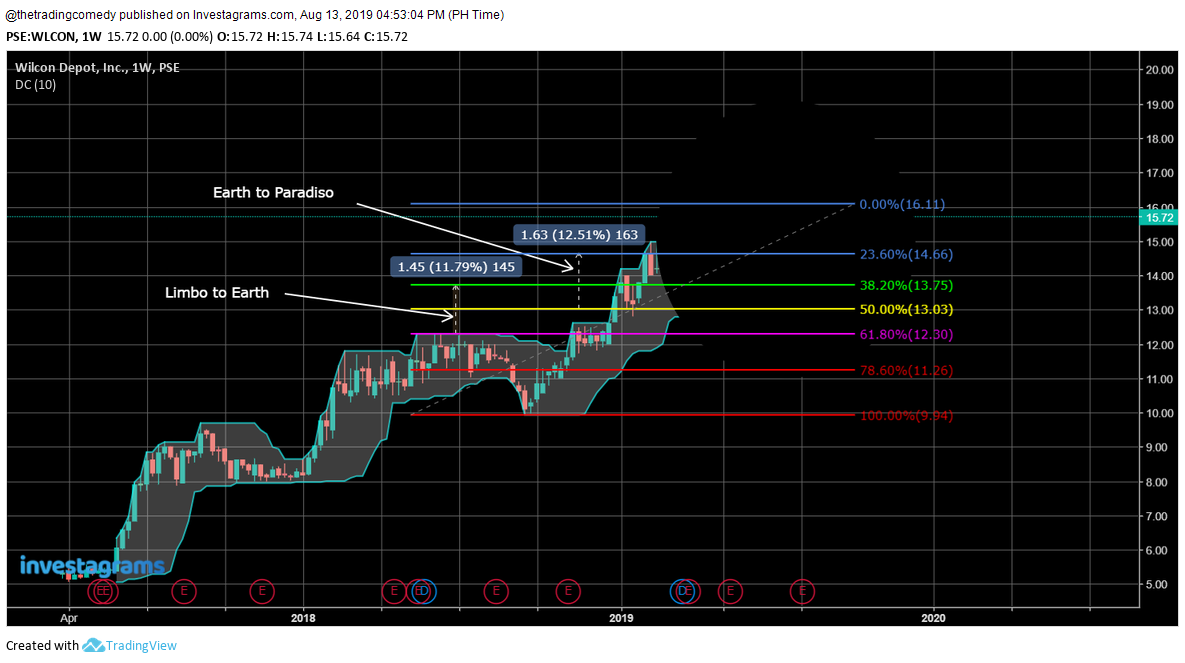
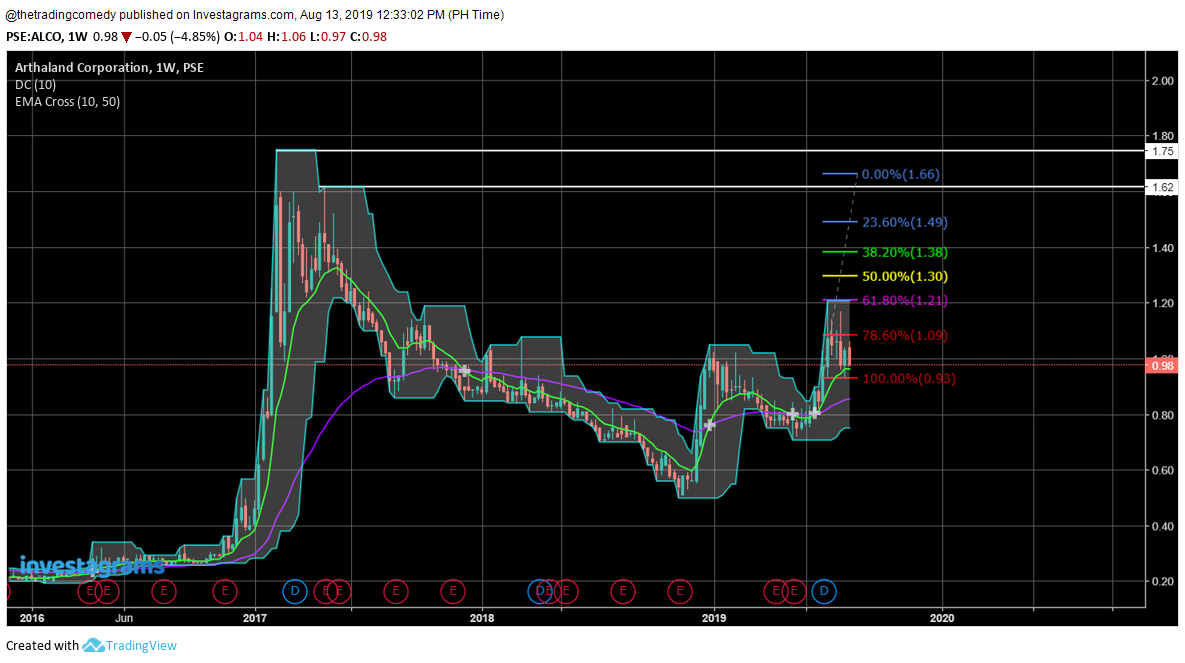
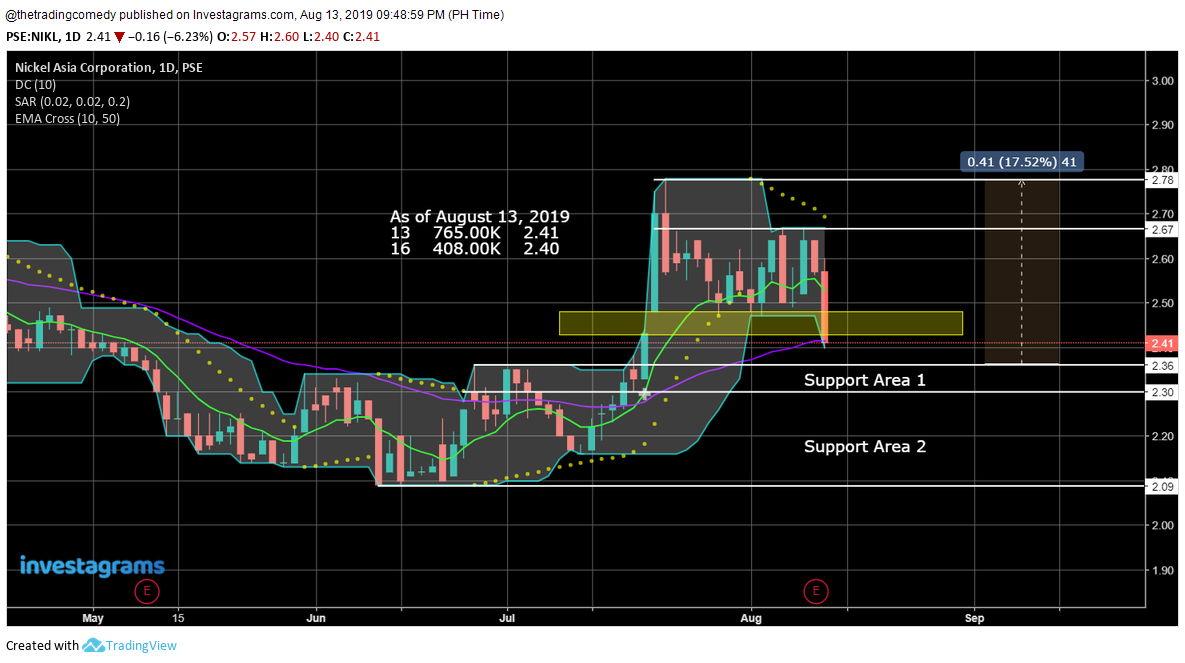
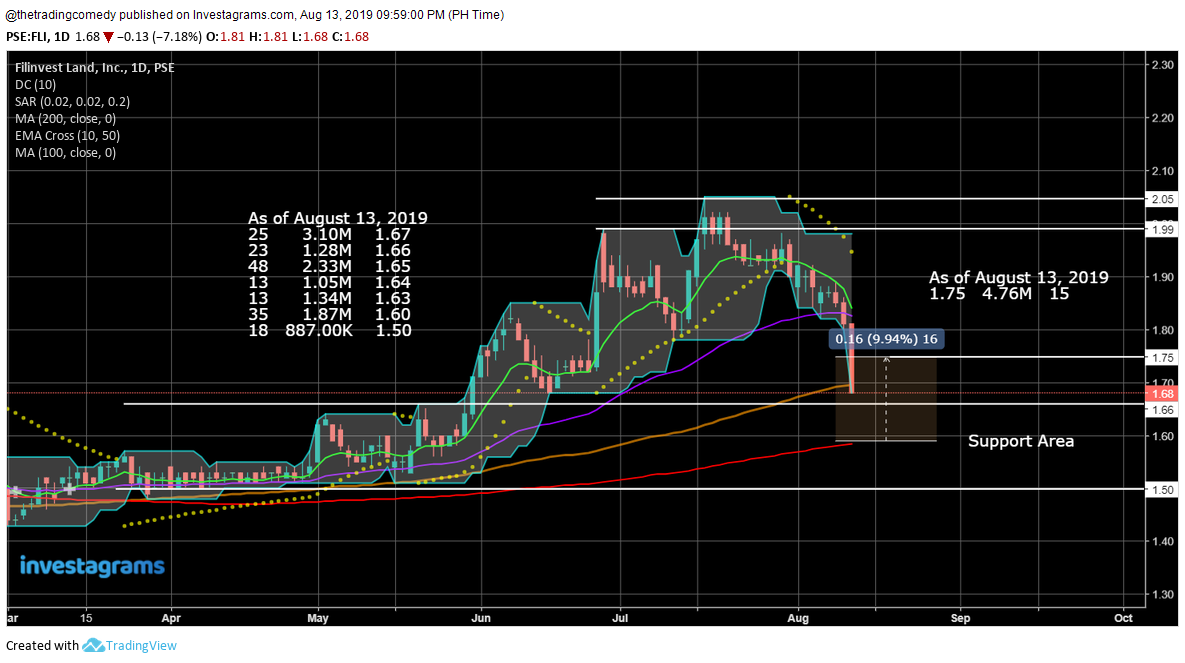
Whoa there! Did you just make me realize that you can ACTUALLY treat the Limbo & Inferno levels as SUPPORTS and Purgatorio & Paradiso levels as RESISTANCES??

Oh great you actually know what supports and resistances are? Nice! But for the benefit of the newcomers here, here’s what it simply means:

Support – A price level where people would most likely buy.

Resistance – A level where people would most likely sell.

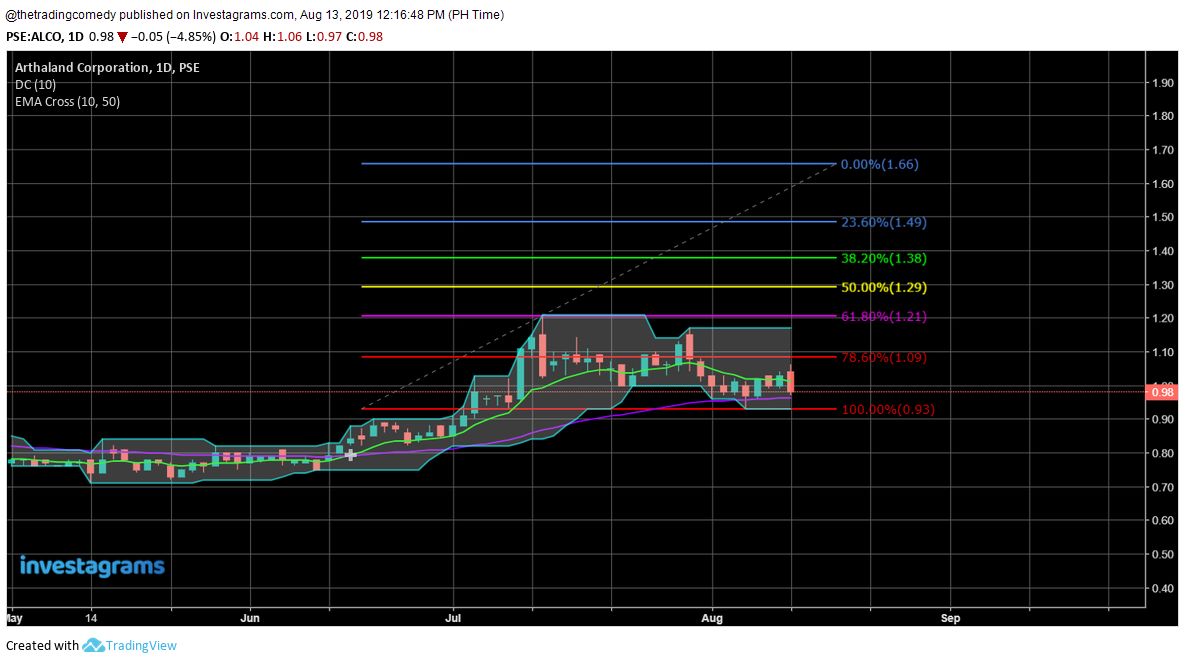
If you actually noticed, I didn’t use the words SUPPORT and RESISTANCE until you reached this area of the blog (unless you noticed one of the figures mentioning those words 😂)

You see reader sometimes it’s just a matter of waiting and executing (and updating your plan, if necessary.)

Planet $MBT Expedition Plan #3

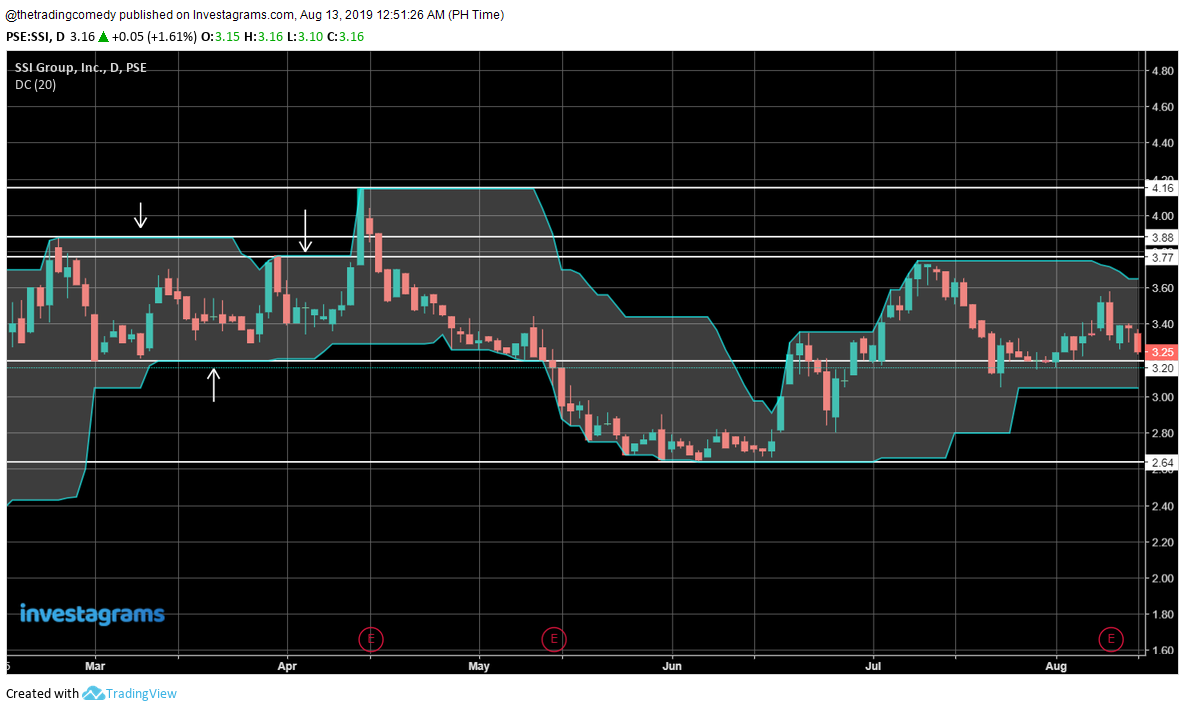
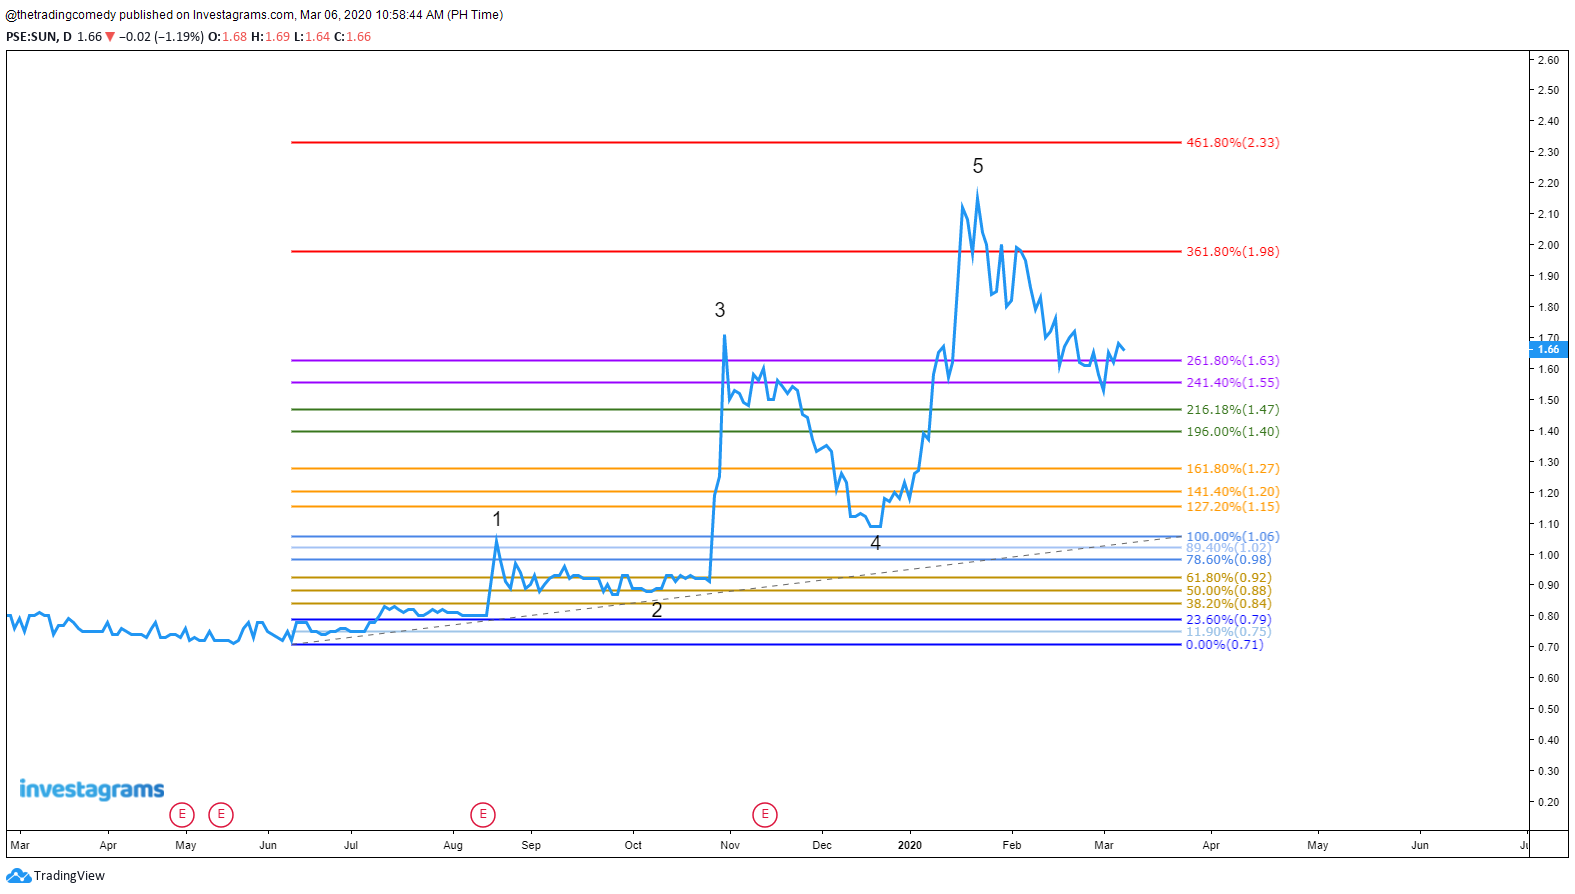
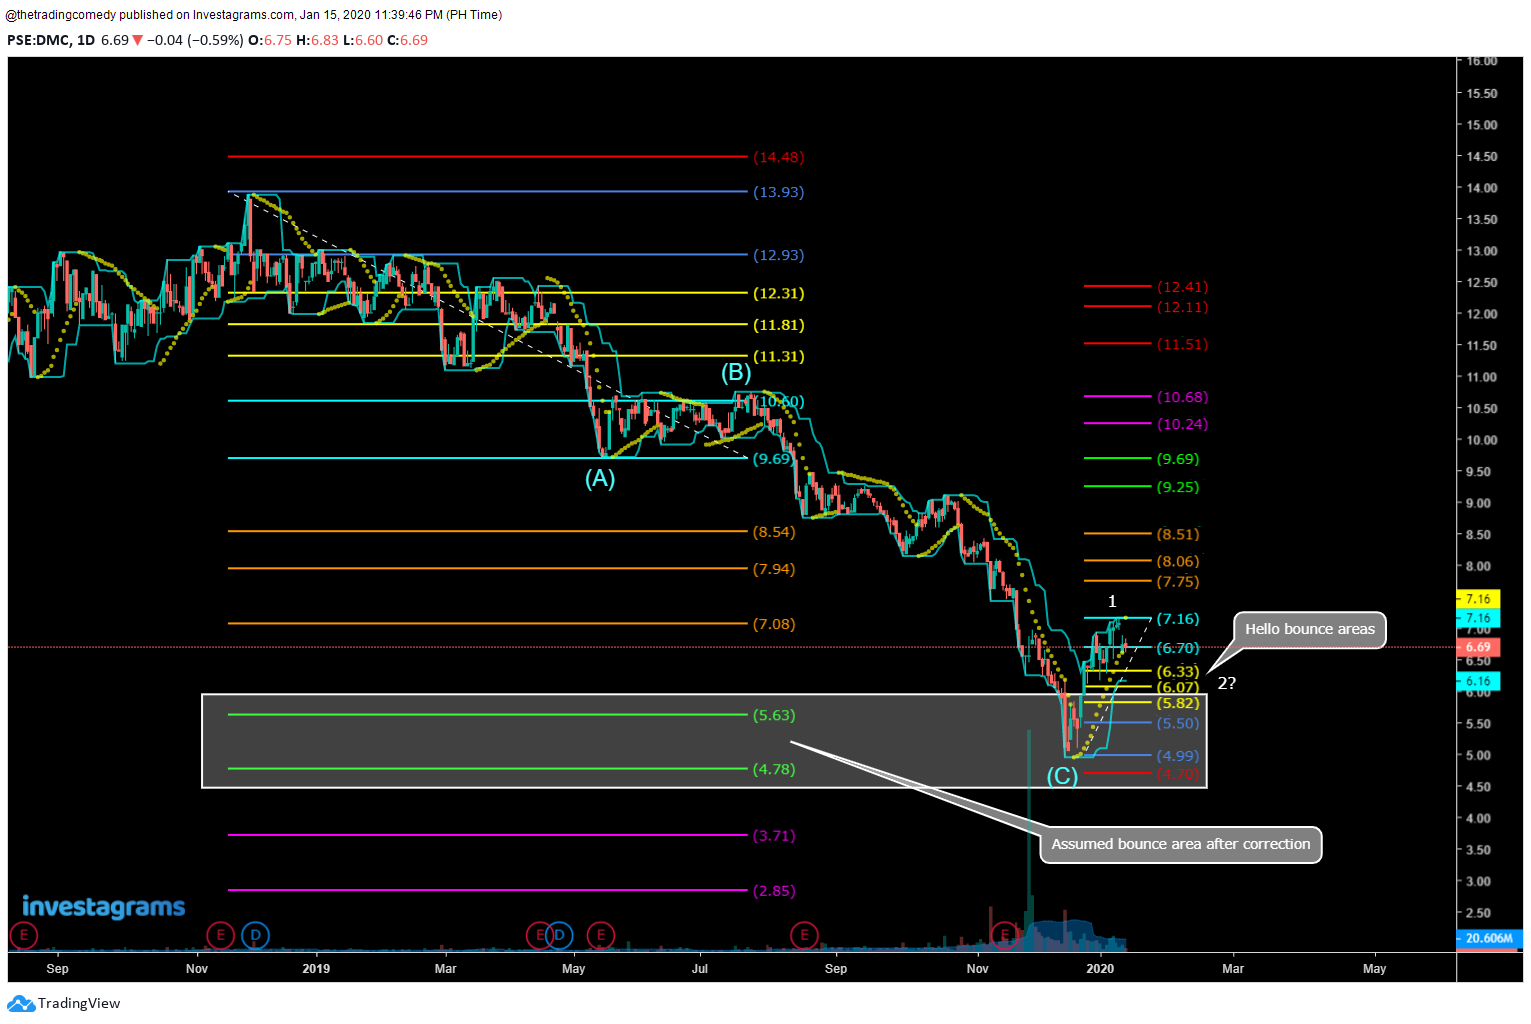
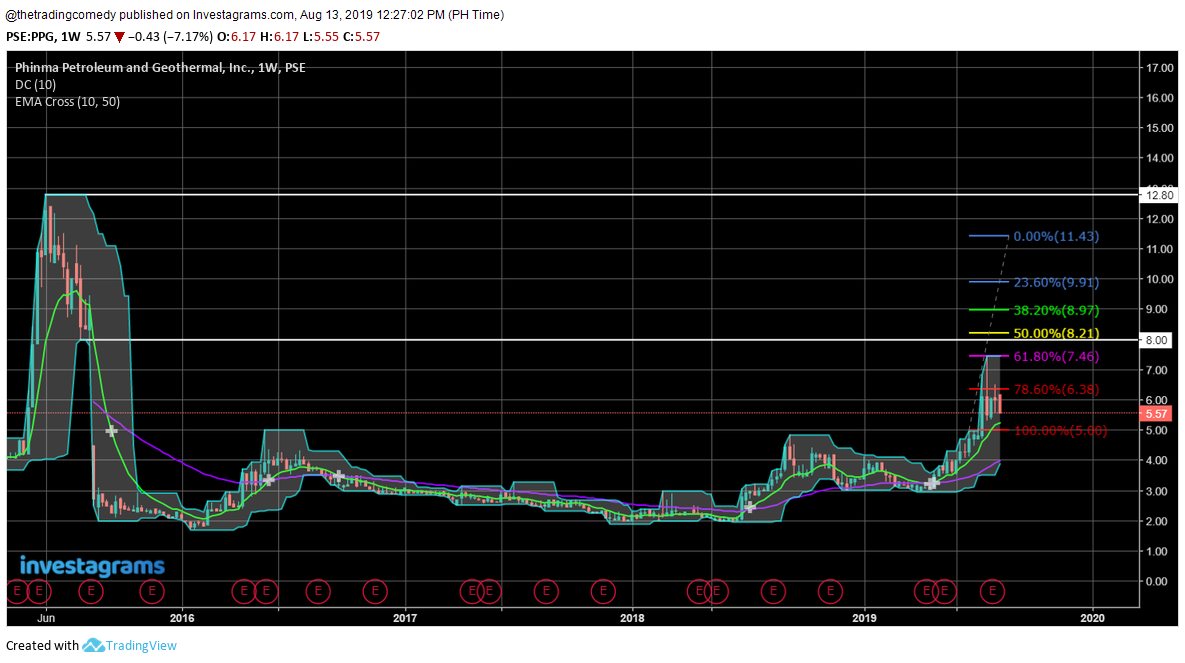
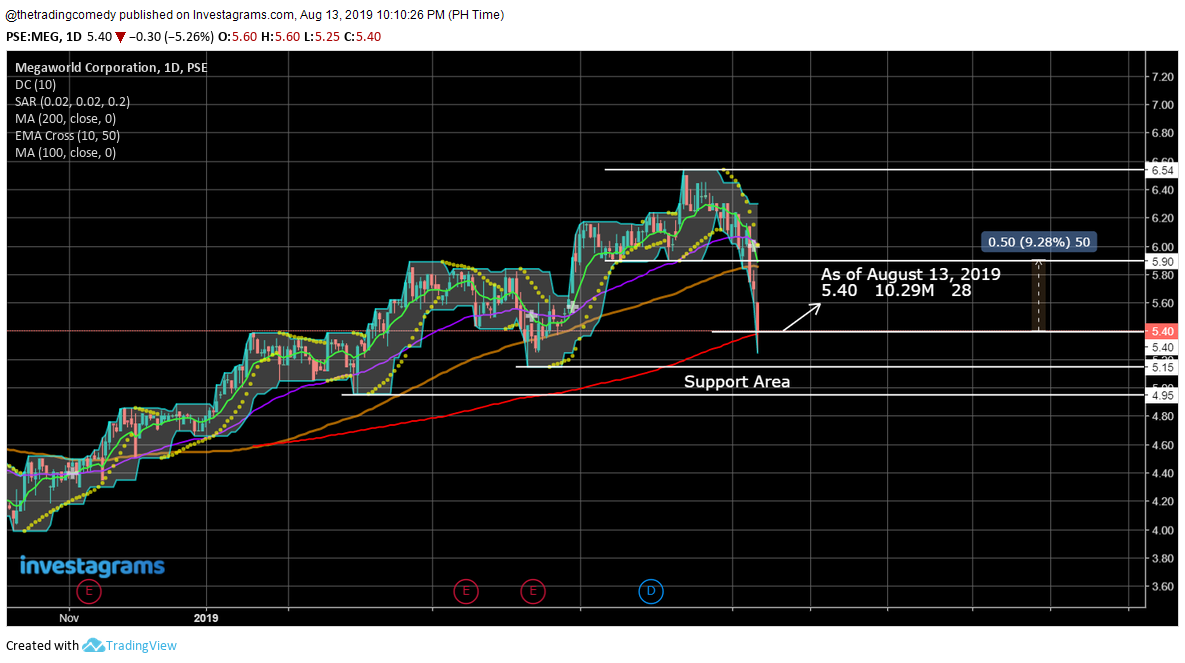
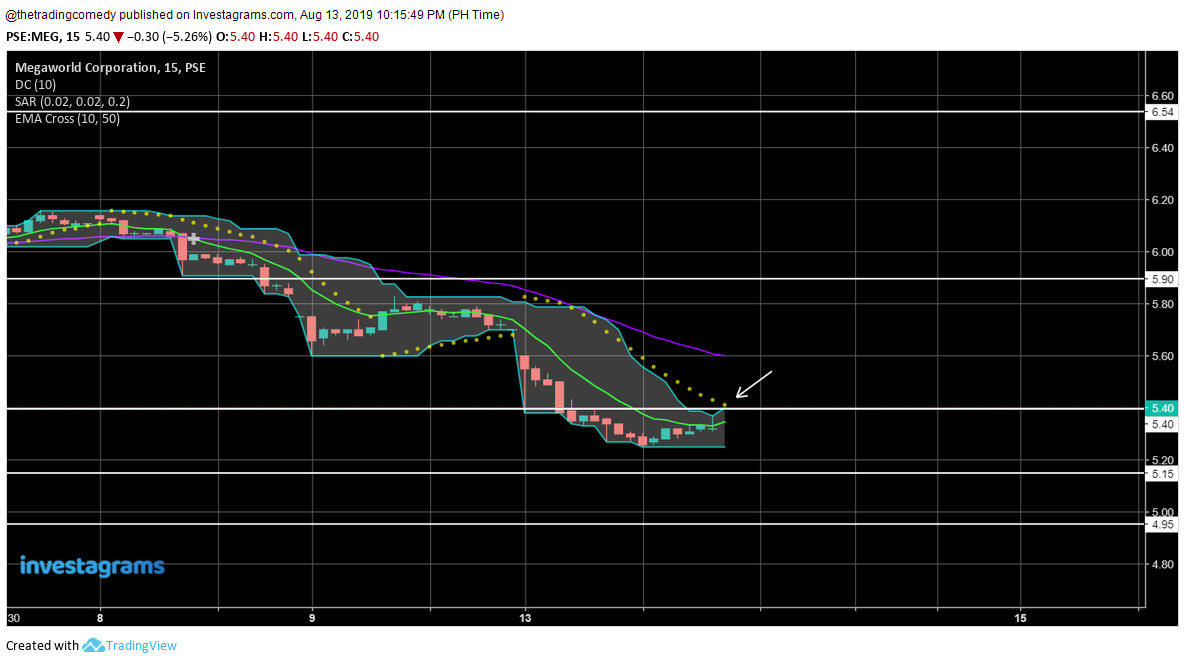
Wait, you can actually use your past Limbo & Inferno as your Purgatorio & Paradiso??

Well, if you want to put it in stock market jargon, yes. PAST SUPPORTS can act as RESISTANCES and vice-versa.

So what is the stock market?

Logical, in a sense that you create a plan and you follow it. It’s simple really but most of us can’t pull it off because either we lack the discipline or we attach our emotions with our decision making.

Artistic, in a sense that when you embark on this journey you will see a lot of planets, having the same patterns again and again probably lowering your risk of losing big in the long run. You’ll probably see it more once you start recording all your trading adventures. And please do yourselves a favor and start recording your trades. DON’T MAKE THE SAME MISTAKE THAT I DID.

If you’re lazy to create an excel journal template you can create an account here at Pltrades (if you’re trading at the PSE) and probably follow me there if you want to see how I do in the PSE universe

Profit? Hmmm well, if you’re not ready to face these kinds of statistics on your first months/years of trading then this may not be for you.

My current stats at the beginning of 2019 up to March as of this writing (and no this isn’t paper trading, IT’S THE REAL THING READER)

You’ll get to a rough start…

On some days, you would think you got it already.

Some days you’ll get confidence boosts like these…

And these…

Some small losses and big wins here and there…

More big wins but your ego takes over and you suddenly take in bigger losses

And then you f*ck up 🤣🤣🤣

Oh yay trading so fun… 😅😅😅

Don’t even go full time trading if you don’t have enough money management to pull this off.

You might be wondering how I manage to trade a lot? It boils down to risk management and proper volume allocation.

I never go all-in. I enter what I can tolerate to lose/gain. I treat money like they’re my soldiers.

On the bright side, if we manage to be profitable in this endeavor, there’s actually no boss to report to but yourself/myself. There are no employees to manage but yourself/myself.

Basically, this job is heaven for introverts. But if you’re an extrovert, that’s fine too. Find a trading support group. 😂😂😂

Why do a lot of people say that entering the stock market is considered gambling?

Entering the stock market would be considered gambling if YOU DON’T HAVE A PLAN.

Sounds like a challenging business to venture out in, so where do I start?

There’s an online trading platform called Investagrams and they can let you create an account for free and you can practice chart analysis there (and did I mention they have a virtual portfolio where you do paper trading without risking real money? Isn’t that awesome? 😁)

When you think you’re ready, go on and open a real trading account and be prepared for the worst.

I am not kidding here: the feeling of putting real money in this game is way different than your usual paper money. If you manage to keep your cool, then great!

If you want to know more about my trading styles then feel free to explore this playlist and subscribe to Pewdiepie (or here 😁)

Good luck reader, and see you on the trading field!

WELCOME TO HELL! 😁✌

Your Trading Poet,

Alex Corner

Featured

The Art of Lazy Spotting Supports and Resistances

Hello there reader, if you stumbled upon this post I recommend reading this first but if you’re a lazy reader, here are some market jargon that you need to know at least:

Support – A price level where people would most likely buy.

Resistance – A price level where people would most likely sell.

I did a video about this, but if you’re saving on time then read this instead. 😂

Before you guys read on this post, I recommend watching this first from Rayner Teo, who’s actually one of the people who influenced my trading journey (and how I actually discovered this MA on steroids as what he would call it 😂)

Again if you’re lazy to watch this then read on instead 😅😅😅

If you’ve finished watching these 2 videos, then great because this is what we’re going to tackle for this post.

Here’s how I actually approach the Donchian Channels indicator.

Let’s say I give you this chart right now, I would ask you, “Where is the support and resistance?”

Most of you would probably answer:

But wait, what if I told you that there’s actually more levels than those mentioned above?

No shit?

Here’s where the Donchian Channels come to the rescue!!! 😂

But wait we won’t be needing that middle band, since we are just focusing on finding other support and resistance levels so let’s clean it up a bit…

Perfect! Now let’s plot those other levels that we see (focus on the left part of the picture)

And voila! You have more supports and resistances to work with! 😂

But wait…I noticed something in the chart….

Ahhhh, I see you spotted some short term rallies?
Yes, these are tricky to catch

Well I’m about to tell you right now…the default length of the Donchian Channels (20) won’t give you much entry opportunities.

There, there…

If you paid attention to the video, the usual entry triggers for the Donchian Channels are usually the break of the upper band (if you’re going long) and the break of the lower band (if you’re going short)

Assuming that we religiously follow the entry trigger rules of the Donchian Channels…

Can you hold for 17 days? 😂😂😂

Here’s another heartbreaking backtest:

Ask yourself, “Am I willing to hold for 526 days to gain 31%?”

So how can we optimize this? There’s no way in hell I’m going to wait for that long especially if there are plenty of stocks in the sea…

Well here’s a trick that I learned and it’s actually simple:

Change the Donchian Channels length to 10.

Now backtest again now using these simple steps:

  1. Find an upper band (for long positions) or a lower band (for short positions) that you want to enter in.
  2. Scan for past lower bands or upper bands for your desired Target Prices (TP)
  3. Simulate the breakout of the chosen band, forward test and see if it works.

Going back to the previous chart, I’m going to use long positions as an example since the Philippine Stock Exchange doesn’t support shorting yet (yeah, it sucks I know but I hope we get there soon 😅)

WTF? Intraday gains is actually possible?!
24% in 2 candles?? What?!
I didn’t even need to plot a Fibonacci Retracement after seeing this.
100+% in approximately 2 months? Wow 😅
How long can you ride this? 😂

Trust me, you’re going to back test like crazy after reading this.

It’s simple but never easy.

There are some indicators that you can combine with the Donchian Channels that can give you some solid setups but I will leave that for another post.

If this is already enough to get you exploring, then good luck in finding your own holy grail setups.

Your Trading Poet,

Alex Corner

Reducing your worries during EOD trading

Have you ever experienced having a good setup but psychologically you still doubt if you want to enter the trade due to “external factors” be it news, social media, or other people’s analysis?

Well, the easiest solution to reduce noise is to turn off your Facebook or Twitter and just open your charting tool.

If you’re an end-of-day (EOD) trader and you want to increase your edge while at the same time gaining “peace of mind” after entering a trade, then you’ve come to the right place.

I will share to you some tips on how to interpret EOD moves.

1. Analyze the order table an hour before the market closes

The order table goes by many names: some call it order book, bid/ask table, or market depth.

There is a way to look for supports and resistances intraday without relying too much on the price chart that you can watch here (this is very useful for trading IPO’s as well if you plan on scalping intraday)

2. Enter before the market run-off

It depends on the situation but most of the time I enter before the run-off. Why did I choose before and not after?

If your trading platform has a feature that can project the closing price of a stock, then you can also use it to your advantage whenever you want to enter before the closing bell.

However, entering before the market run-off is somewhat a double-edged sword as there are stocks that suddenly buy up or sell down when the market’s about to close.

So you have to keep an eye on possible news or catalysts that may make or break a stock.

Hope this post helps and feel free to share your other advice.

Lazy Elliottician’s Food For Thought: The Power of Lines

A lot of trading resources nowadays are so obsessed with candlestick chart patterns and strategies that they tend to neglect this type of chart and it’s also the simplest to look at.

What if I told you that all you need in trading the markets especially if you are counting basic Elliott Waves is actually a line chart?

One thing that I realized while plotting my Lazy Elliott forecasts using this retracement is that whenever I use the candlestick chart view, it can be prone to misconceptions.

Other analysts may critique your wave count telling you that it’s not valid but in fact it is!

Let’s take a look at this example:

“ThIs Is nOt A vALiD cOuNt”

I understand that some of you might say that it’s not a valid count at first glance because one rule in counting an impulse wave is that Wave 4 cannot overlap Wave 1.

This example can be misleading to others because they are thinking just because the label overlapped or the price visited the area of Wave 1 they will conclude that it’s not a valid count.

But what happens if we switch it to a line chart:

What overlap were you guys talking about again? 😂

This is where the saying “price is king” applies. As you can see, when switching to a line chart view, your only concern are the closing prices. Look closely at the chart again, clearly you could see that there is no overlap!

So as Lazy Elliotticians, how can we plot the retracement on a line chart and use it to our advantage?

For spotting an Impulse Wave:

  1. Find the lowest high and the lowest low that you could find.
  2. Draw the retracement from your chosen high and low from top to bottom.
  3. If you see the price bounced off an area of Wave 2, it is a qualified lazy plot.
  4. Count/forecast the remaining waves.
  5. If you observe that your forecast is breaking an Elliott Wave rule, go back to Step 1.
Following steps 1 to 3 will yield to this result.

As for the remaining waves, there are a couple of ways to count this.

For spotting a Corrective Wave:

  1. Find the highest high (Assumed Wave 5) and the highest low (Assumed Wave 4) that you could find.
  2. Draw the retracement from your chosen high and low from bottom to top.
  3. If you see the price bounced off an area of Wave B, it is a qualified lazy plot.
  4. Count/forecast the remaining waves.
  5. If you observe that your forecast is breaking an Elliott Wave rule, go back to Step 1.
Following steps 1 to 3 will yield to this result.

Let’s see where it will go. Usually the price should correct either up to 100% or up to 161.8% beyond, if it’s a deep correction.

Wow that is one deep correction!
You could’ve made a fortune if you shorted this but wait, I forgot that we’re in the PSE.
We don’t have shorting 😂😂😂

Usually when I see something like this, I would recount it especially if it breaks down 261.8%. You might want to rethink this chart and flip the wave order, like this:

You can do this in currency pairs as well depending on where your bullish bias is but I leave that to you.

And for the last step that applies to both impulse and corrective waves: consult another indicator (e.g. PSAR, Moving Averages, RSI) for your preferred trade setup, if necessary.

To summarize everything that you just read, here’s a flowchart. Now quit slacking off and start practicing!

City Management Games That Can Help In Trading

Who says that video games can’t help you with your development as a trader? Don’t get me wrong, the beginning of your trading journey you will be immersed in charts but as time goes by you’ll get to appreciate this business.

If you get this right in the long run, you’ll realize that the beauty of trading is that you don’t need to look at the screen all day once you already know what to look for.

If you’re that trader who’s having a losing streak, you shouldn’t be discouraged. In fact, you should be happy because the market doesn’t really scold you if you don’t trade but she does give you a beating in your trading account if you do things wrong. 😅

It’s just going to be there for a long time and you can go back once you’re prepared again to face the trading field.

Without further ado, here are my go-to city-building games that helped me as a trader.

Cities: Skylines

No photo description available.

Originally I would prefer SimCity but in this day and age especially with the advancement of graphics, this game should suffice. What this game will teach you is actually the dynamics of supply and demand and this game gives it clearly.

Notice the bars below. Those indicate demand for Residential (Green), Commercial (Blue) and Industrial (Orange), respectively

As you build your city over time, you will observe that your citizens will want certain facilities such as residential, commercial, or industrial zones. Create too much zones in any of those 3 areas, you will observe that there won’t be any development going on plus you will also lose money in the process. Not to mention you also have to pay attention to what the citizens need (e.g. Healthcare, Transportation, Parks and Recreation) if you want them to be happy with living in your city.

Just like in trading, you must know when the stock that you are looking at is currently in demand. A stock that has high demand usually has a bullish rally but at the same time too much demand can cause it to fall as well so on that note, you should know when to get out.

Maybe you can read about the 2008 Financial Crisis if you want a deeper understanding on why these things happen or better yet watch The Big Short on Netflix and you’ll understand what I’m talking about.

Dawn of Man

From humble beginnings…

This is a game set in the stone age where you have a tribe and your objective is to create a sustainable civilization for them to live in.

Ahhhh, stone age zen…

If you want those casual management games, this one might be for you. The game currently has a few modes but if you want to challenge yourself, you can try out the ice age.

A trading trait that you can probably acquire with playing this game is survival aside from the game focuses on the stone age this game will also teach you how to unconsciously take care of your capital just like taking care of your tribe. 😂

Me: Oh yay, my tribe is thriving! 😂
Also me: Oh look a line chart, reminds me of stocks. 😂

Surviving The Aftermath

Compared to Dawn of Man this game is a bit more complex. Think of Fallout Shelter with a mix of Civilization in terms of gameplay. If you like both of those games, this is definitely worth the try. The game sets in a post-apocalyptic era where you have a group of survivors and your goal is to survive as long as you can by creating a town with the given resources that you can find.

Prepare to face yourselves with challenges that can threaten your existence, be it a heat wave, to meteors falling down from the sky, you name it!

Ahhh, nuclear fallout 😅

But wait, where’s the lesson in trading that you can apply when playing this game? One word, RESILIENCE.

Hello sustainable post-apocalyptic civilization! 😂

Without this quality, I doubt that you can survive in trading especially if you plan on doing this full-time. You will learn what to prioritize whenever you trade just like in this game, you will be faced with decisions that can save or kill your colony.

How to thirst your colonists to death in less than 48 hours? 😅

Tropico 6

I have been a huge fan of the series since the first one came out and I must say, this is the game that taught me a lot of things especially when handling money in this game. I’m such a fanboy, that I influenced one of my trader friends to play this instead of Anno (although I like the visuals there as well 😂)

Compared to the other games I mentioned, this showed me how trading is done in a whole new level! Although the learning curve for this game can somewhat be overwhelming, trust me once you get through the tutorial, you’ll get the feel of being a ruler and you will appreciate the visuals this game has to offer. You would even feel like spending your summer vacation in the island, especially if you’re into beaches.

Me: Welcome to paradise! ✨
Also me: We’re in f****** debt, we need money 😢

Basically, you’re a dictator running an island off the Caribbean and the game includes a Campaign and a sandbox mode where you can decide what goals you want to achieve with your island.

Do you want to rule for 20+ years? Do want to be a master trader in the island by relying on exports as your main source of income? Want to create a militarist state in your island by keeping it protected from rebels? How about making your island a tourist destination? Or making your island the greatest place to live in by making your citizens happy? The possibilities with this game are endless.

Since game is focused in a Caribbean setting before the World War, what you’ll actually learn here is more about earning money through different ways, with imports and exports as the main method of generating income.

Sounds like trading if you ask me and if you are a beginner and you want to try out this game, I suggest focusing on building raw resource buildings to get a feel on how to generate income for your island. Along the way, you’ll learn how to efficiently spend your money on other matters.

This game has everything you can ask for from a trader’s perspective. You can learn how to deal with economic (and mostly political) situations especially if you want your island to be profitable and sustainable at the same time.

This game even has a broker. 😂😂😂

If you relate this game to trading, you will also learn that technicals, along with fundamentals, can drive the price to go up and down; you just need to consult the right news sources.

Whether you’re a fundamentalist, a technician or a hybrid in the financial markets, it doesn’t matter. I think you would get to appreciate the games that I mentioned.

So there you have it! I hope this game guide helps you and always remember, there is more to life than trading.

Head off to Steam and buy these precious gems (and if you’re getting Surviving The Aftermath, you can buy it here)

Now go out there and play! ✌

The Trading War Room (January 15, 2020)

Hello first stock analysis blog post of 2020!

For this week we take a look at the possible movers in the Philippine Stock Exchange.

Yep, we’ve been on sideways for a year. 🤣🤣🤣

As we can see, the index is still on sideways and given its close today, it is possible that we might see it revisit 7,500 levels for the next couple of days.

If we actually observed the movement from November 2018 to February 2019 we had a brief bull run.

Sana maulit muli 😆

For this blog post we’ll be focusing on bounce plays and pullback plays. Don’t expect too much for breakout plays since the current sentiment of the entire market has been quite bearish for this week (we dropped like 129 points for today)

With the phase one trade deal signing between US & China going on this week, we may see some stocks react for the next couple of days.

Time to spot some outliers!

Here are my top 3 stocks for the week using smaller timeframes since we are looking for short-term opportunities for us to go long (so when will shorting be implemented here in the Philippines huh?! 😂😂😂):

$ACEX

Yes, we’re looking at an oil stock since it might also influence the deal 😂
Corrective Retracement (Left) vs Impulse Retracement (Right)

If you managed to position last month (December 2019), you should’ve gotten some pretty decent profits already and at least got out near 9.00 – 10.00.

Right now, it is trying to find a bounce point and we see that it closed with the doji and might hold the 8.00 level.

These levels are probably the “sweet spot” if you want to play its potential bounce.

$DMC

Well for this week, DMCI Holdings got pretty battered probably because of these headlines that popped out over the weekend…

What’s our beloved president doing? 😅

…which actually resulted to this:

The price actually gapped down; buy the fear I guess 😂

As long as the price holds at 5.80 – 6.00 the potential bounce play is still intact.

$TECH

Impulse done!

Congratulations to those who played this stock last week and for those who caught our Lazy Elliott impulse forecast for this stock.

Fundamental wise, I don’t see much going on with the PSE Edge for this stock, this analysis is purely speculative for the moment. We’ll know tomorrow what direction this stock will take us (US & China, do your thing 😂)

If we look at our Lazy Elliott corrective forecast for this stock, we might see it revisit near 6.00 so set your risk management if you want to play this one.

Recounted the impulse + applied our lazy elliott retracement for the corrective wave

If you read our Lazy Elliott guide you already have an idea what ideal levels you should look at to take profits (the answers lie in the color grouped lines 😉)

Good luck trading poets!

May The Odds Be Ever In Your Favor - Effie GIF - Maytheodds Beeverinyourfavor Effie GIFs

A Lazy Approach to Elliott Wave Theory

Greetings Trading Poets!

Today is another new year and for this post I’ve decided to share to you a technique that I discovered around last quarter of 2019.

We will be talking about Elliot Waves!

I understand why some people don’t want to use this to forecast price movements since it’s very tiresome to do in the long run so before reading through this blog post, I suggest you read some of the basic concepts of Elliott Wave Theory or watch this video before continuing on (and I hope you get to appreciate this post after watching):

Please subscribe to my YouTube channel for more content especially if you think I will be
a big help in your trading journey.
(Start @ 1:35 to find out why it is tiresome to do the “usual”)

Here’s what an Elliott Wave cheat sheet usually looks like:

cheatsheet2
This looks like a lot take in.

Assuming that you have read at least the basics of forecasting price movement using Elliott Theory, you will find plotting the Fibonacci retracements tend be tedious in the long run (not to mention if you get the counting wrong, you would redo the entire thing again and again!)

So after implementing this cheat sheet for a few months, I got tired of doing this over and over, I had some sort of “Aha” moment.

I remembered this quote that I read (a lot of sources said it was Bill Gates who said this):

“Choose a Lazy Person To Do a Hard Job Because That Person Will Find an Easy Way To Do It”

And it got me thinking that yes, the cheat sheet works and with enough practice I got to somewhat forecast the prices correctly but there must be a more efficient way to forecast waves without drawing a lot of retracements just to verify that the waves are “correct”.

There must be an easier way to do this…

It took me a few months to discover this but I am proud to say that this custom retracement solved all my forecasting headaches!

Yes trading poet! You read that right. Regardless of what type of wave you want to look at, whether it be an impulse or a corrective wave, all you need is ONE RETRACEMENT to give you the projected forecast of the entire movement of a candlestick chart!

Let’s check out this example. Say you’re looking at a Forex chart and you assumed that you’re looking for an impulse wave and you want to know where Wave 1 and 2 is:

No, we are not going to draw trend-based fibonaccis just to find out where Wave 3 is or not even draw the rest of the retreacements just to get the entire forecasted impulse.

Like I said, we only ONE RETRACEMENT to forecast the entire impulse. Let’s apply it right now…

Voila! A bold prediction!

I know what you’re thinking right now. You must be like…

How the f*** did he know that the prices would hit those areas??

“He’s insane!

No way in hell those prices will hit on those assumed levels!

Alright! Let’s see where the prices actually went…

Yay Impulse predicted! 🥳

Oh would you look at that! The prices actually hit our projected levels based on ONE RETRACEMENT.

OMFG the retracement acted like a crystal ball!

Some of you might think that Wave 5 is not done yet, which is actually understandable, since the ideal end of an impulse wave is Wave 5 should be at least above Wave 3.

What we actually encountered here is an impulse wave with a truncated 5th if that’s the case.

Oh where are my manners? This is the part where I tell you on how to actually plot this. 😂

So let’s start with the retracement first.

You may want to set your retracements this way:

UPDATE (as of April 2020)
Fibonacci Retracement Settings

It is highly recommended to put a color coding scheme for your levels so that you immediately have an idea on what wave your current forecast is in.

Here are the ideal color groups for each Fibonacci Level (again you can use your own color coding scheme, it’s just a matter of preference, really):

Wave 1: 78.6% – 100% (An entry area for breakout plays; Conservative profit taking also happens here if you entered from a bounce)

Wave 2: 38.2 – 61.8% (An entry area for bounce plays; you could also use this area for conservative profit taking if you entered from 0.00, which rarely happens, to 23.6%)

Wave 3: 196 – 216.18% (Aggressive profit taking levels; this is usually the LONGEST WAVE but not the SHORTEST)

Wave 4: 127.2 – 161.8% (Conservative profit taking levels if you entered from Wave 2 or the breakout of Wave 1; 161.8% can also be a profit taking level if you observe the price bounces off 38.2%)

Wave 5: 241.4 – 261.8% (Usually where the wave ends; Additional profit taking level if you entered from Wave 4; you would usually support this level with an oscillator divergence, if necessary)

The only step you need for drawing the retracement is this:

FIND THE ASSUMED WAVE 1: Plot the retracement from top to bottom (0-100% Levels)

That’s all really, no more no less. If you’re new to reading price charts and you want to be more accurate in your forecasts, I suggest you wait for a Wave 2 movement until it creates a clear support level.

The only time your assumed Wave 1 becomes invalid is that if Wave 2 goes below your assumed Wave 1 (0.00%) Re-draw the retracement if that happens.

Here are some guidelines as well when you’re forecasting an impulse retracement:

  1. There are rare cases when Wave 2 bounces off 23.6%; adjust your projected Wave 3 up to 127.2% and use 161.8% as a bonus level or use the default projected area of Wave 3.
  2. There are also cases where Wave 3 can extend up to 261.8% so adjust your projected Wave 4 to where Wave 3 is usually projected (196 – 216.8%) or you can use the default projected area of Wave 4.
  3. If Wave 5 extends beyond 261.8%, you can use additional Fibonacci Levels (e.g. 300 – 361.8%) for your projected end wave.

Now let’s proceed on how to forecast the corrective retracement.

Just like the impulse retracement you only need to do one of these steps

FIND WAVE 4 to 5 OR WAVE 5 to A: Plot the retracement from bottom to top (0-100% Levels)

Let’s go back to our example and plot it right now.

Another bold prediction 😂

Like I said a while ago, putting color coding schemes to your levels will save you a lot of time in planning your trades. So here are some levels to take note of when looking at a corrective wave based on this retracement:

Wave A: 78.6% – 100% (If you’re lucky and you got Wave 5 right, you can actually use this level to take profits if you shorted this)

Wave B: 38.2 – 61.8% (Bounce area for the next short)

Wave C: 127.2 – 161.8% (Where the corrective wave usually ends; 161.8% can also be considered as a “Dead Cat Bounce” level if you observe the price bouncing of the Alternate Wave C instead of this one)

Alternate Wave C: 196 – 216.18% (If for some reason the price aggressively breaks down, this could be an additional area for profit taking when you’re shorting. This level can also be used to plan bottom picking plays)

Here are some guidelines as well when you’re forecasting a corrective retracement:

  1. There are rare cases when Wave B bounces off 23.6%; the default projected area can still be used to forecast Wave C (it usually resists at around 127.2 – 141.4%, so treat 161.8% as an offshoot level)
  2. If the price bounced off from the Alternate Wave C and resisted from the ideal Wave C levels (127.2 – 161.8%) you might be looking at a reverse impulse move instead of a corrective move (or a dead cat bounce if you redraw the retracement from Wave 5 to Alternate Wave C top to bottom)
  3. If the price broke out from the ideal Wave C levels and resisted to the previous Wave B or Wave 5 level, you might be looking at another impulse move in the works. You can draw the impulse retracement (top to bottom) from 2 perspectives:
    • From Wave B to Wave C
    • From Wave 5 to Wave C
  4. Pray you won’t get bashed by other financial analysts from forecasting the reversal (especially if you get it wrong 🤣)

Now let’s see where the price went…

Wow magic! 😆

So let me guess, the next move would probably be an ongoing impulse wave assuming that forecasted Wave C holds (but with the tensions going on in the US the price chart might paint the picture differently)

Looks like Wave 3 is done and Wave 4 is either ongoing or we are now proceeding to Wave 5.

Or if you want to look at it from another angle…

Plotting the Impulse Retracement From Wave 5 to Wave C

Looking from this EURUSD chart, we can see that the price might continue to go down to the Wave 2 area. Now you see why I encourage to use different colors for the levels because you can see the technical narrative clearly (if you can incorporate fundamentals to this chart, even better)

Anyway, I’m saving the trade setups for another post (I actually applied this already in some of my real trades, you can check it out on my Facebook page) but for the seasoned traders reading this post, I kinda gave away the levels you need to watch out for, if you read between the lines. 😆

This is enough for you guys to get started in forecasting your charts and hopefully discovering magical trade setups that you could do along the way.

I’m pretty sure after reading this entire post, you will never look at Elliot Waves the same way again. 🧐

Happy backtesting!

P.S. If what I explained in this blog post is still not enough, then grab these cheatsheets and save them (and thank me later if this method saved your trading career as I’m currently saving mine 😂)

I bet you missed the typo 😂
UPDATE (As of April 2, 2020): WE HAVE A NEW CHEATSHEET TRADING POET BUT WITH LINES!
Watch the video below 😁
For some advanced forecasting concepts skip to 10:20 😁

For traders based in the Philippines, feel free to subscribe to InvestaPrime here.

The Yin and Yang of Busking and Trading

If I can generate this amount of money in a just few hours maybe I could do the same with trading.
I just need to put in the work the same way that I did here.

People nowadays don’t realize that whatever you’re constantly doing can be a means for you to create a living out of it.

So for this post, I decided to share my insights about the similarities of busking and trading since it’s my current lifestyle and I have come up with some guidelines below.

Anyway, I might miss out on some guidelines, but these are the most important, to me at least.

And if you’re planning on going full-time on busking or in trading, make sure you have saved a lot of money (in my case I saved at least 1-2 years worth of living expenses) so you won’t get burned out, physically, mentally, financially. This is also your time to find other skills that you think will make you happy in the long run aside from your main passion.

Better be prepared for anything life will throw at you.

Let’s begin!

Busking

  1. Before performing at any location, make sure that the spot that you want to perform on is safe. Be observant. Check for any passage points where you think a lot of people will pass by. Spotting intersections can generate a higher chance of returns. Also check if there are people around passing by because if there aren’t any, you should’ve just practiced at home.
  2. Record how much money you received for the day so that you will have an idea when is the best time to perform in that particular spot especially if you’re starting out. Reduce your expectations as well on the first few days. Just because you practiced well doesn’t mean you’ll get a guaranteed return in that specific spot. Again, be observant.
  3. You don’t have to perform in public for the whole day or even every day. Just choose specific days, time and duration that you think will give you the highest returns based on what you experienced performing in that specific spot. Time is precious in this endeavor, that’s why if you plan on going over your usual routine, make sure you offset in the next days. Whatever money you recorded on your previous busks will give you the answer.
  4. Use paydays, weekends and holidays to your advantage; these are the days where usually a lot of people go out.

Trading

  1. Before trading any stock, commodity, currency pair, etc., make sure you have a plan. Also check if there are a lot of people participating because if there aren’t any, you’re just wasting your time.
  2. Record all your trades, especially when you’re starting out. Don’t expect that you’ll get all these setups right away. Better to focus on one first, whether be it swing, breakout, bounce plays, etc. Reduce your expectations as well on the first few months. Just because you practiced well doesn’t mean you’ll get a guaranteed return in that specific setup. Again, it’s you against your own psychology.
  3. You don’t have to trade everything you see especially if it’s for the sake of trading. Spot your setup niche and trade only those setups that you’re comfortable with. Since time is also precious, plan a time stop for every trade just in case your plan took longer to materialize than expected. Your trading journal will also give you the answer.
  4. You can use disclosures to your advantage but don’t put too much weight on whatever news you heard and just focus on how the technicals will react and execute your trades accordingly.

The best part of these two activities is if you perform well here early on, you get to have more time for your future self to do other things that you’re so passionate about. 😂

Here are some busking data that I recorded to give you an idea how much you can gain from doing this based on my nightly routine (spending 1 – 3 hours worth of your time on average and assuming you already have an idea when and where to busk and you do this consistently for more than a year)

Anything is an opportunity, you just need to know where to look and learn
when and how to execute.

You can download Monefy on the App Store (for iOS) or Play Store (for Android) if you want a budget tracking app for your smart phone (not a paid advertisement 😂)

I hope this post motivates you, feel free to share your other guidelines. Now go out there and find your passion!

“It’s alright to WORK for a LIVING, just don’t forget to LIVE.”

Me (as a busker): Thank you to the lovely couple who stopped and listened to my original songs. May God bless your soul .
Also me (as a trader): Hooray $MEG illiquid sentiment tonight but I see ceiling play! 😂

RADSIX: Spotting Potential Rallies & Reversals Before They Actually Happen

Hello reader, for this post I am going to show you how to combine the Relative Strength Index (RSI) and Average Directional Index (ADX) to spot signals on when to enter a trade.

Back then, I would use the Directional Movement (DMI) indicator for confirming trend direction aside from what the price action is giving me but when I think about it, more lines f**k up my decision making. So here’s what the transition looked like. 😂

1st section: Price Action
2nd section: Directional Movement
3rd section: Directional Movement (without the ADX)
4th section: RADSIX 😁😁😁

Sorry for startling you reader, let me clean this up so you could get that sense of clarity.

Now tell me what’s easier to understand. 😂

I will be summarizing it in this quick guide below (with chart examples of course! 😁✌)

The last 2 items can be tricky to spot and you will need to pay attention
to price action for this to work in your favor.

This template is more ideal for spotting LONG opportunities. Shorting opportunities using this template show up rarely (at least in the PSE, except when you’re trading more volatile markets like Forex and Crypto) so it’s best to use price action for spotting short opportunities along with either the RSI or ADX.

The indicators used are the following:

  • Donchian Channel (10)
  • Parabolic SAR (0.02, 0.02, 0.2, Default)
  • RSI (14, Default)
  • ADX (14, 14, Default)
  • Optional: MA/EMA 10/20/50/100/200 depending on what trend you want to filter

Personally, I rarely use MA’s now because of psychological barriers with my trade planning.

The Donchian Channels should be enough already to what levels I should be looking for (+ Fibonacci Retracements if I’m going to apply my lazy approach Elliott Wave Theory which I would probably save for another post)

And now some chart examples so you could see how it’s done:

The Parabolic SAR is your best friend ✌✌✌
Free monthly fractal 🤣
$GREEN Daily Chart: Bullish Sideways?
$GREEN Hourly Chart: WRONG! 🤣
That volume spike though 😁
The fact that this stock consolidated for more than a year makes it
more exciting to watch when it broke out 😂

Oh and if you want to level up your analysis skills using this trading template, you could try out reading forex charts for fun like this example below:

So many trade ideas just by looking at one chart 🤣
Poof! Another trade idea 🤣
Some trades I made using a Forex demo account to test if this template
I’m using actually works for inspirational purposes. Risk managed I guess. 😂

I hope this post helps with your trading journey and good luck!

Happy backtesting! 😁

This post is inspired by hitting 3,000 followers on my Facebook page and closely hitting 1,000 subscribers on my YouTube channel. 😂

The Art of Lazy Speculation with Fibonacci Retracements

That feeling when your trading software suddenly lags because you dug up too far at the charts (well, you can switch to higher timeframes to save you time, lol)

Okay, before you lash out think for one second: I did not say Fibonacci is useless. 😂

It’s more of a recipe for disappointment to be honest.

Oh wait, there’s also what you call Fibonacci extensions but guess what? I don’t use them as well. 😂

If you’ve been following me ever since I started this trading journey, I like doing things out of the box.

So with that said, I will share to you a Fibonacci Retracement trick that I use that’s specifically for anticipating 52-week highs and All-time highs (or breakout plays from these highs)

I like to call it: Limbo Fibonacci.

How to plot this is actually easy.

So here are the steps:

  1. Do the art of lazy spotting support and resistance assuming that you read my post regarding this.
  2. Measure your chosen support and resistance. Make sure it’s at least over 20% and the trade range should be at least more than a month. This range is actually enough regardless of your trading profile (Swing, Momentum, Bounce, etc.)
  3. Plot your Fibonacci Retracement with your chosen support matching the 100% level (Inferno) and your chosen resistance at the 61.8% level (Limbo)
  4. Enter at the break of Limbo or within Inferno (78.60% – 100%)
  5. Take profits at your chosen Fibonacci levels:
    • Limbo (61.80%, e.g. if you entered from Inferno and you wanted an early exit)
    • Earth (50%)
    • Purgatorio (23.60 – 38.20%)
    • Paradiso (0.00 – 23.60%)
  6. Stop loss depends on your risk tolerance but it is usually a couple of points below your chosen entry level.
  7. The Limbo Fibonacci becomes invalid if the price breaks down the 100% of the Inferno level.

Here’s what it would look like if you plot it and we’ll compare it against a Fibonacci extension plot and decide for yourself which one looks more convincing for you. ✌

Let’s turn back the clock, take a look at $ALLHC for example.

This stock recently broke an All-Time high this year.

Say you wanted to enter when the price breaks the All-Time high. So you would probably plot your Fibonacci Retracement like this:

That 161.80% level reward looks tempting but will it even reach?
Great! The stock broke the All-time high but it didn’t reach the 161.80% and it broke down instead. 😂😂😂

Now let’s try plotting the Limbo Retracement…

Let’s say the stock that we’re looking at seems to be far away from the All-time High (ATH)

You could actually trade this if the price was able to enter at the Inferno level (100%) and exit at the next Inferno level (78.60%) or at the Limbo level (61.80%) a.k.a. All-time high.

Let’s see what happens after…

Congratulations you gained 26.11%, you just did a long swing play.

On the other hand, the All-time high did break out but you notice it almost reached the Earth level (50%) and almost resisted to that level so probably you should’ve thought about leaving the stock at this point (e.g. cut loss below Limbo or sold near Earth)

Let’s have another example, here we have a chart of $WLCON using the usual way of plotting the Fibonacci (with extensions again of course)

Hmmmm, I wonder if this stock can reach 161.80%?

Now let’s see what happens after…

Yay, we got the 35.45% profit! 💙

If you want a trend-based Fibonnaci, you might plot and plan it like this (if you’re an Elliot Wave trader you might be fans of using these. Don’t bash me for this, I’m still working on the next blog, lol)

Probably you could’ve escaped at around the 78.6%-100.00% level
(Sorry golden ratio, you’re not there yet)

Now let’s use the Limbo Retracement again using the same example. 😂😂😂

For this example I made the Inferno Support at 9.94 and Limbo Resistance at 12.30 referencing a past DC upper band.
Oooooh multiple entries 😆

Q: Can I use this strategy even if the price is not reaching 52-week highs/all-time highs?

A: Actually you can, but plotting this with existing past prices looks redundant from my perspective.

However, this method can also be useful if you don’t want to be obvious on what Target Prices (TP) you are attempting to reach.

Let me show you what I mean.

Ahhhh Limbo Retracement, time to lazy speculate the shit out of this XD
For this example I used 5.00 as an Inferno support and the 52-week high as the Limbo resistance

If we try to explore the past chart data…

Ooooh, so that’s where they’re attempting to reach if the price rallies, let me choose a level from the Limbo Retracement so it won’t be obvious. ✌✌✌

Using Fibonacci isn’t that bad, as long as you know how to follow your trade plan and react accordingly.

Time to lazy speculate again…Hello Limbo Retracement!
Inferno (Support) set at 0.93 and Limbo (Resistance) set at 1.21

Whether you’re using Moving Averages, Elliot Waves, etc. it doesn’t really matter as long as you know where to enter and exit.

Hmmmm, the levels shown in this weekly chart for the rewards seems tempting.
I don’t trust the wicks so let me pick a level from this Limbo Retracement instead.

And there you have it, I hope you learned something new today!

To cap off this post, here’s my quick crash course on how I usually do my trades.
Do subscribe as well so you get notified on my new videos. 😁

P.S. Be careful if you ride a stock up to Paradiso, you don’t wanna become like Icarus (unless you’re shorting 😅)

Your Trading Poet,

Alex Corner

The Trading War Room (August 13, 2019)

Annyeong! So this week’s PSE has been bloody so expect these series of stock analyses to be focused more on potential outliers rather than blue chips (except for probably one because it was the most traded today 😂)

The PSEI’s current bias for today is still bearish for the week, but we notice the candle being pushed up showing hints of bullish activity.
From an hourly standpoint we observed that the PSEI for the last hour of trading day did a bullish run as observed from the last candle before closing.

On a personal note, I’m not that open to any breakout or momentum plays yet so I would be focusing more on possible bounce plays for this series.

Disclaimer again: I am not a fan of bounce plays but I find ways to play them anyway. This might be a good time to practice trading them (with low volume allocation of course 😂)

Let’s begin!

$ALCO

This stock dropped to almost 9% today but observing the market depth at closing, we are observing a large amount of volume lining up at around 0.90 thus speculating a psychological support in that area.

Take note that the price is currently below EMA 50 as well.

Expecting a probability that it might revisit the 0.90 area tomorrow.

The price actually closed above 0.90 despite the bearish candle

Support Area 1: 0.84 – 0.90

Support Area 2: 0.71 – 0.84

Resistance Area: 1.00 – 1.21

Possible Reward: 10 – 30%

$NIKL

This stock dropped to 6% today but as seen on the chart, the price is trying to bounce off EMA 50.

Market depth suggests at closing that there are possible psychological supports at 2.40 and 2.41.

A quick swing trade might be suitable for this stock.

Caveat if it breaks down further.

The price filled the gap at 2.43 but closed at 2.41

Support Area 1: 2.30 – 2.36

Support Area 2: 2.09 – 2.30

Resistance Area: 2.67 – 2.78

Possible Reward: 8 – 18%

$FLI

This stock tried to hold 1.70 but failed to do so resulting in a close at 1.68.

Possible scenarios tomorrow would either be a breakout from MA 100 or a test bounce from MA 200.

Pay attention to the 1.75 level because it’s currently acting as a temporary resistance

Support Area: 1.50 – 1.66

Resistance Area: 1.99 – 2.05

Possible Reward: 10 – 28%

$MEG

Today, this stock was traded over 10,000 times…damn.

Yep, you read that right…10,000 TIMES! 😨😨😨

This stock closed above MA 200 but since the price opened with a gap down, there’s a strong possibility in might drop lower.

On the other hand, if the index tomorrow shows a bullish mood it’s also possible that it can do a 1-day reversal to fill the gap tomorrow (hello quickie swing if ever, but better if it breaks 5.90 then closes above 6.00 🤣🤣🤣)

MA 200 bounce might be possible but given the gap down, the chances are slim.
The 15-minute time frame is suggesting that it might to a Parabolic SAR breakout.
Good to watch. *grabs popcorn*

Support Area: 4.95 – 5.40

Resistance Area: 5.90 – 6.54

Possible Reward: 8 – 20%

Good luck trading wanderers!

Your Trading Poet,

Alex Corner

Design a site like this with WordPress.com
Get started